
Analysis
Review your closed trades by account and period, tag what you traded and what went wrong, and read the numbers behind your results.
Analysis turns your trade history into a review: P&L, win rate, drawdown, a daily calendar and a list of every trade you can tag and comment on. It describes what already happened in your accounts. It doesn’t predict results.
Before you start
- Connect a trading account. See Connect a trading account.
- Close at least one trade. When a position closes, it’s added to your journal automatically, and Analysis reads it from there. Some figures, such as gain and drawdown, come from your connected account rather than your journal.
If AO offers sample accounts, you can explore Analysis before connecting anything. See Sample data below.
Pick what to look at
The bar under the Analysis heading controls every section on the page.
- Section tabs: Overview, Return, Risk and Trades.
- Date range: 30 days, 90 days, 1 year or All history. The page opens on 90 days. Ranges move forward with the calendar, so a page left open overnight stays current.
- Account: All accounts, or one account from Active accounts or Archived accounts. All accounts adds up exactly the accounts listed in the picker. Trades from an account you’ve removed from Accounts, or trades with no account, are never part of it. If you have any, the picker lists them as Removed accounts, under Not in All accounts.
- Colour profile: Terminal candles, Monochrome or Green / red. It changes how gains and losses are coloured, and it’s saved on this device.
- Ask: opens questions about your trades in the current scope. See Ask about this scope.
The account and range are part of the page address, so a link you copy opens the same view.
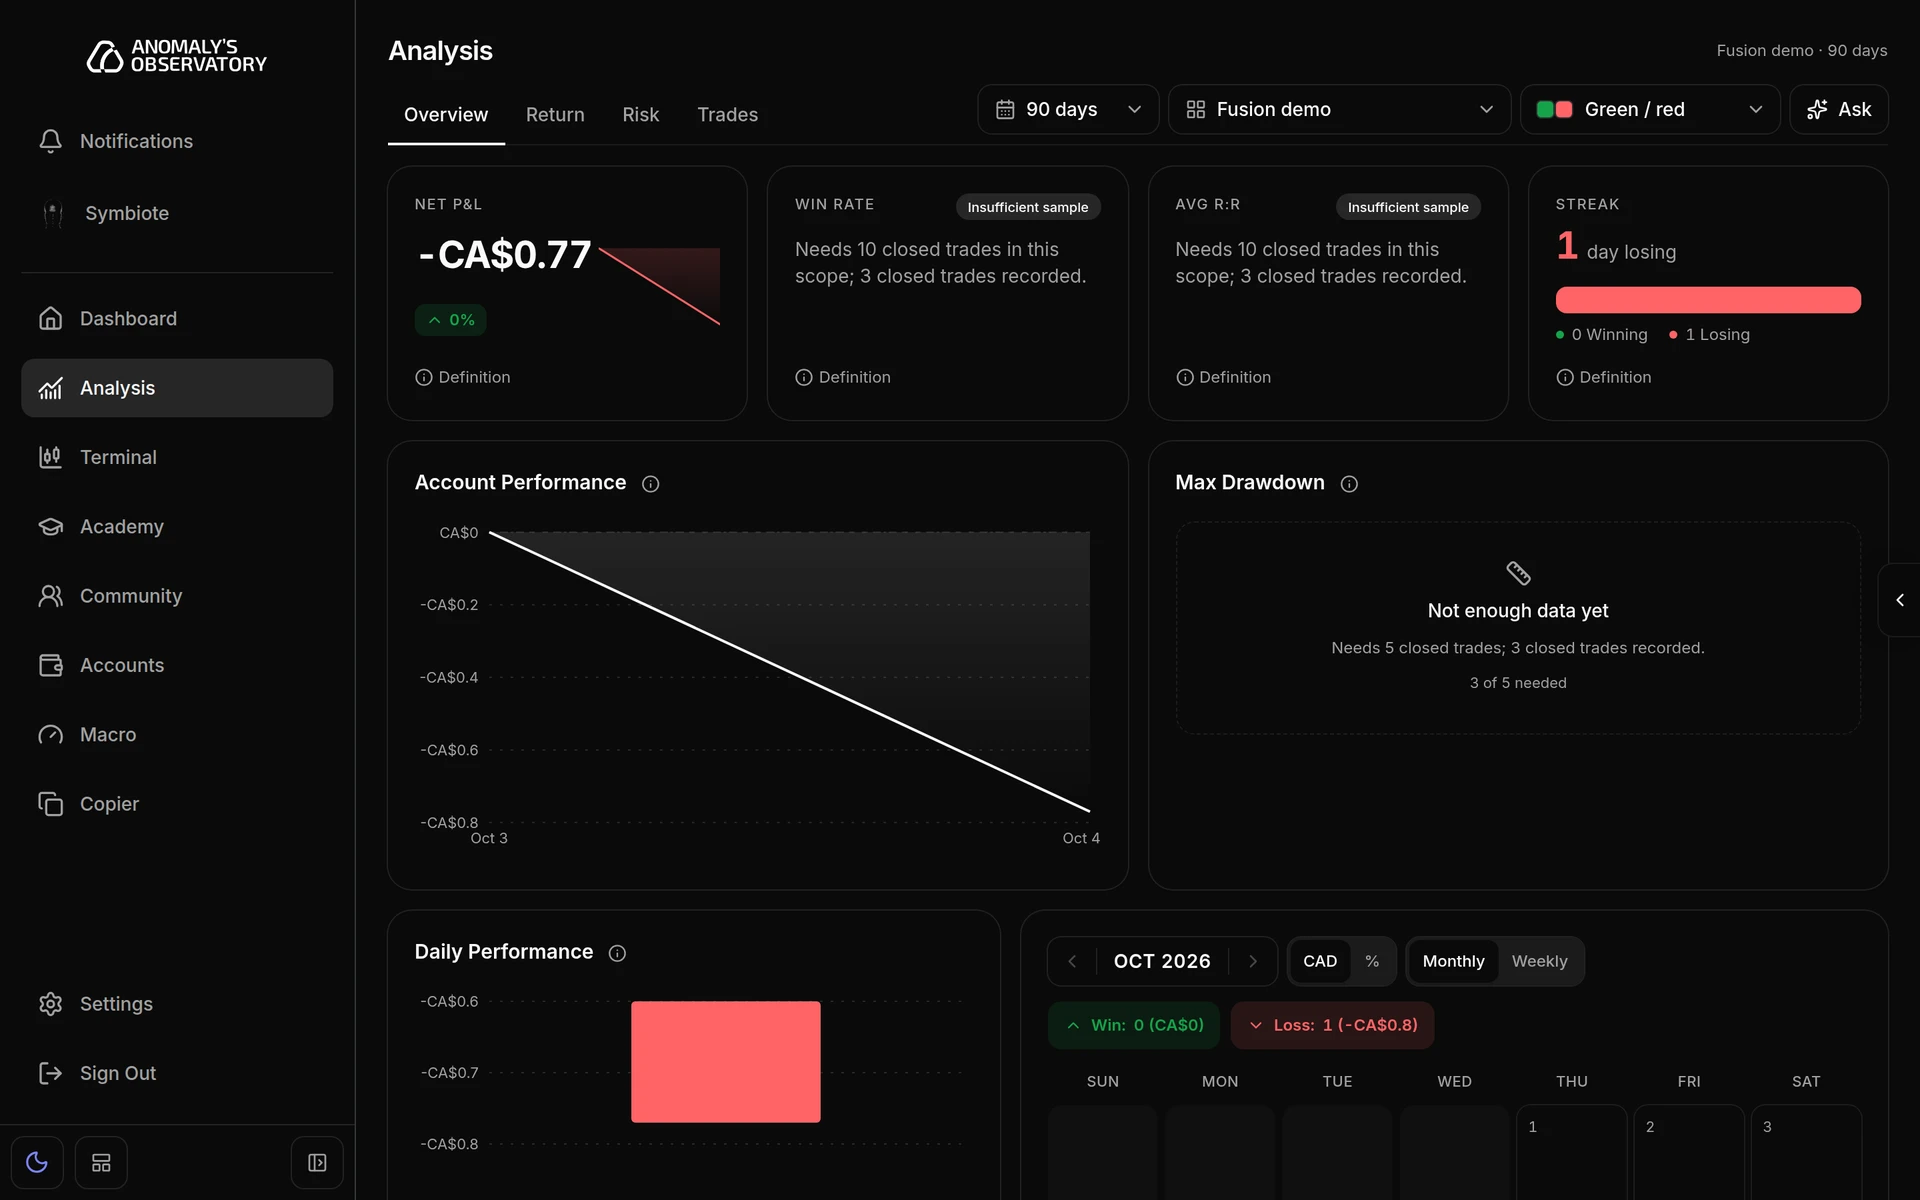
Each headline card has a Definition link. It explains how the number is worked out, where it comes from, and how many trades it’s based on. A card with too few trades says so instead of showing a number.
Overview
Overview reads from top to bottom:
- Net P&L, Win rate, Avg R:R and Streak cards.
- Account Performance (cumulative P&L) beside Max Drawdown.
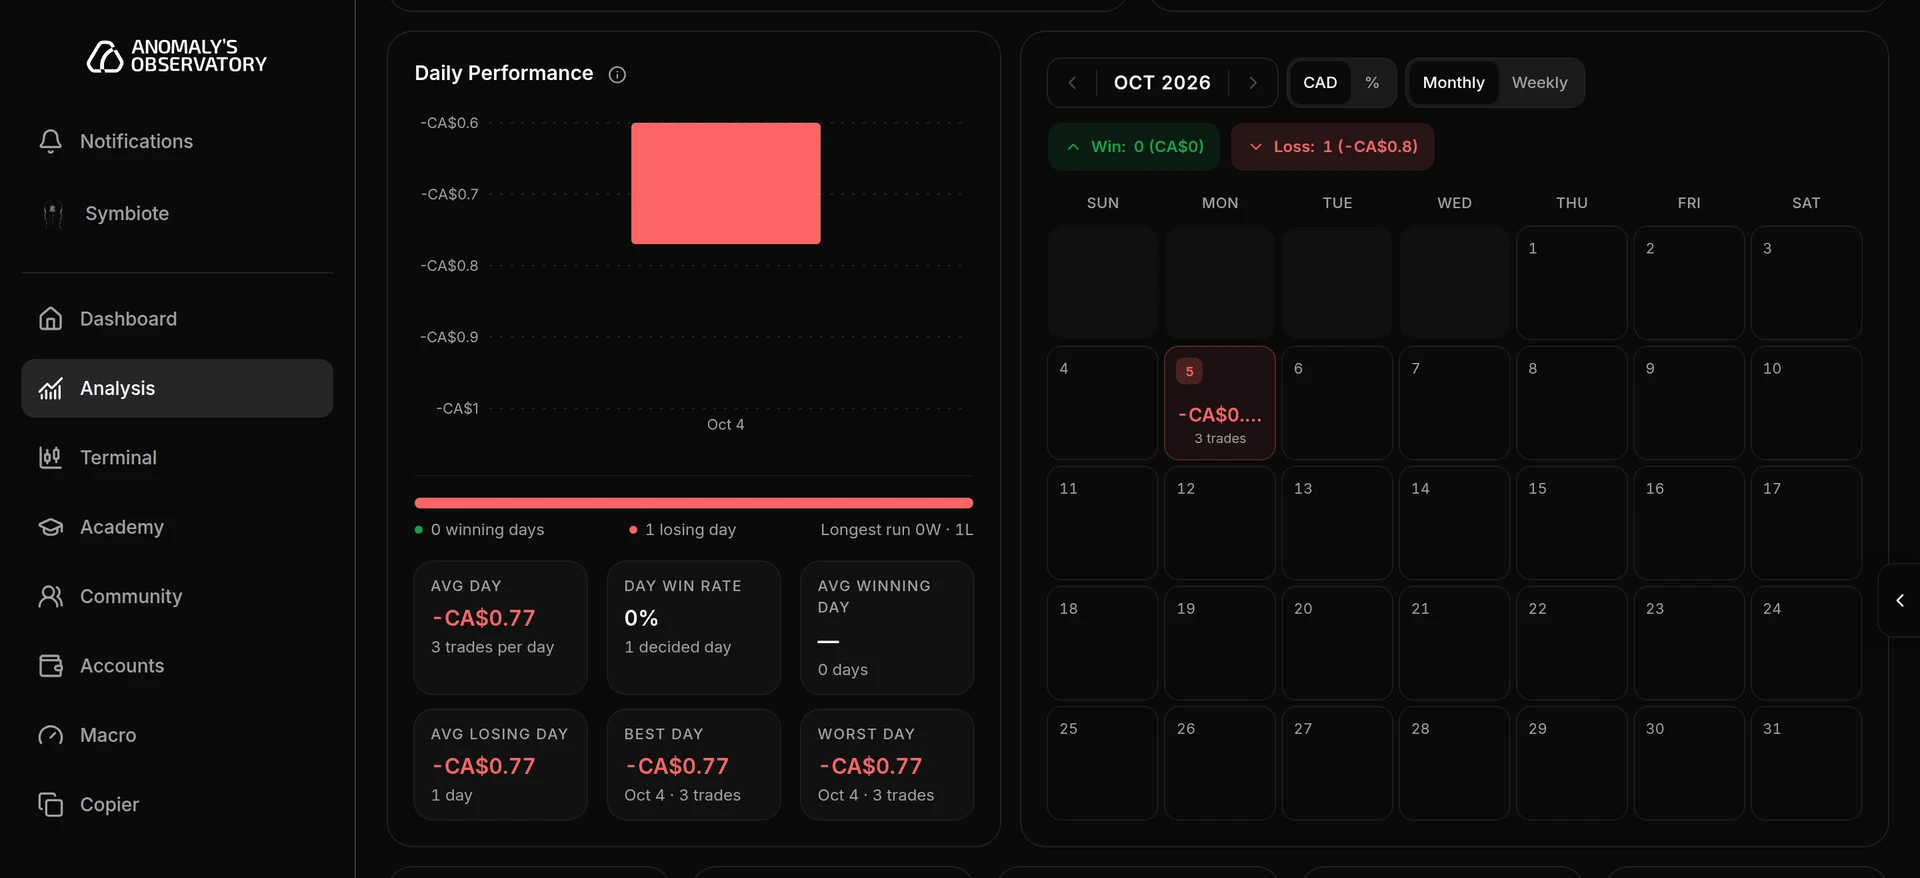
- Daily Performance: realized P&L per trading day, with your average day, day win rate, best and worst day underneath.
- A calendar of daily results. Step through months with the arrows, switch between your account currency and %, and switch between Monthly and Weekly.
- Profit factor, Expectancy, Best trade, Worst trade and Avg duration.
- Monthly Performance, Symbol Breakdown, and your latest trades under Open positions and Closed trades. Review all trades opens the Trades tab.
Return and Risk
Return shows your Track record (gain, net P&L, per-trade expectancy, drawdown, balance and trade count), a growth chart you can switch between Growth, Balance and Profit, Period Performance, Your stats, the spread of your daily P&L, rolling P&L, and results By symbol.
Risk shows the Underwater Plot (how far below its last peak your P&L sat each day), Risk Metrics, your Worst Drawdowns with when each one recovered, the Distribution of Daily P&L, and results By volume. Exposure and leverage are live figures, so they’re listed under Exposure and leverage rather than charted.
Review a trade
Tagging trades is what lets Analysis group your results by setup and by mistake.
- Open the Trades tab. Choose Open trades or Trade history.
- Narrow the list if you need to. Search by symbol, tag or comment, or use Filter to show only wins, losses, buys, sells, Terminal or manual trades, or trades with no setup tag. Columns adds or hides columns.
- Click Review on a trade.
- Under Setup, pick what you traded, such as Breakout or Pullback. You can pick up to three.
- Under Mistakes, pick what went wrong, such as Early entry or Moved stop. You can pick up to five.
- Write a Review comment, then click Save review.
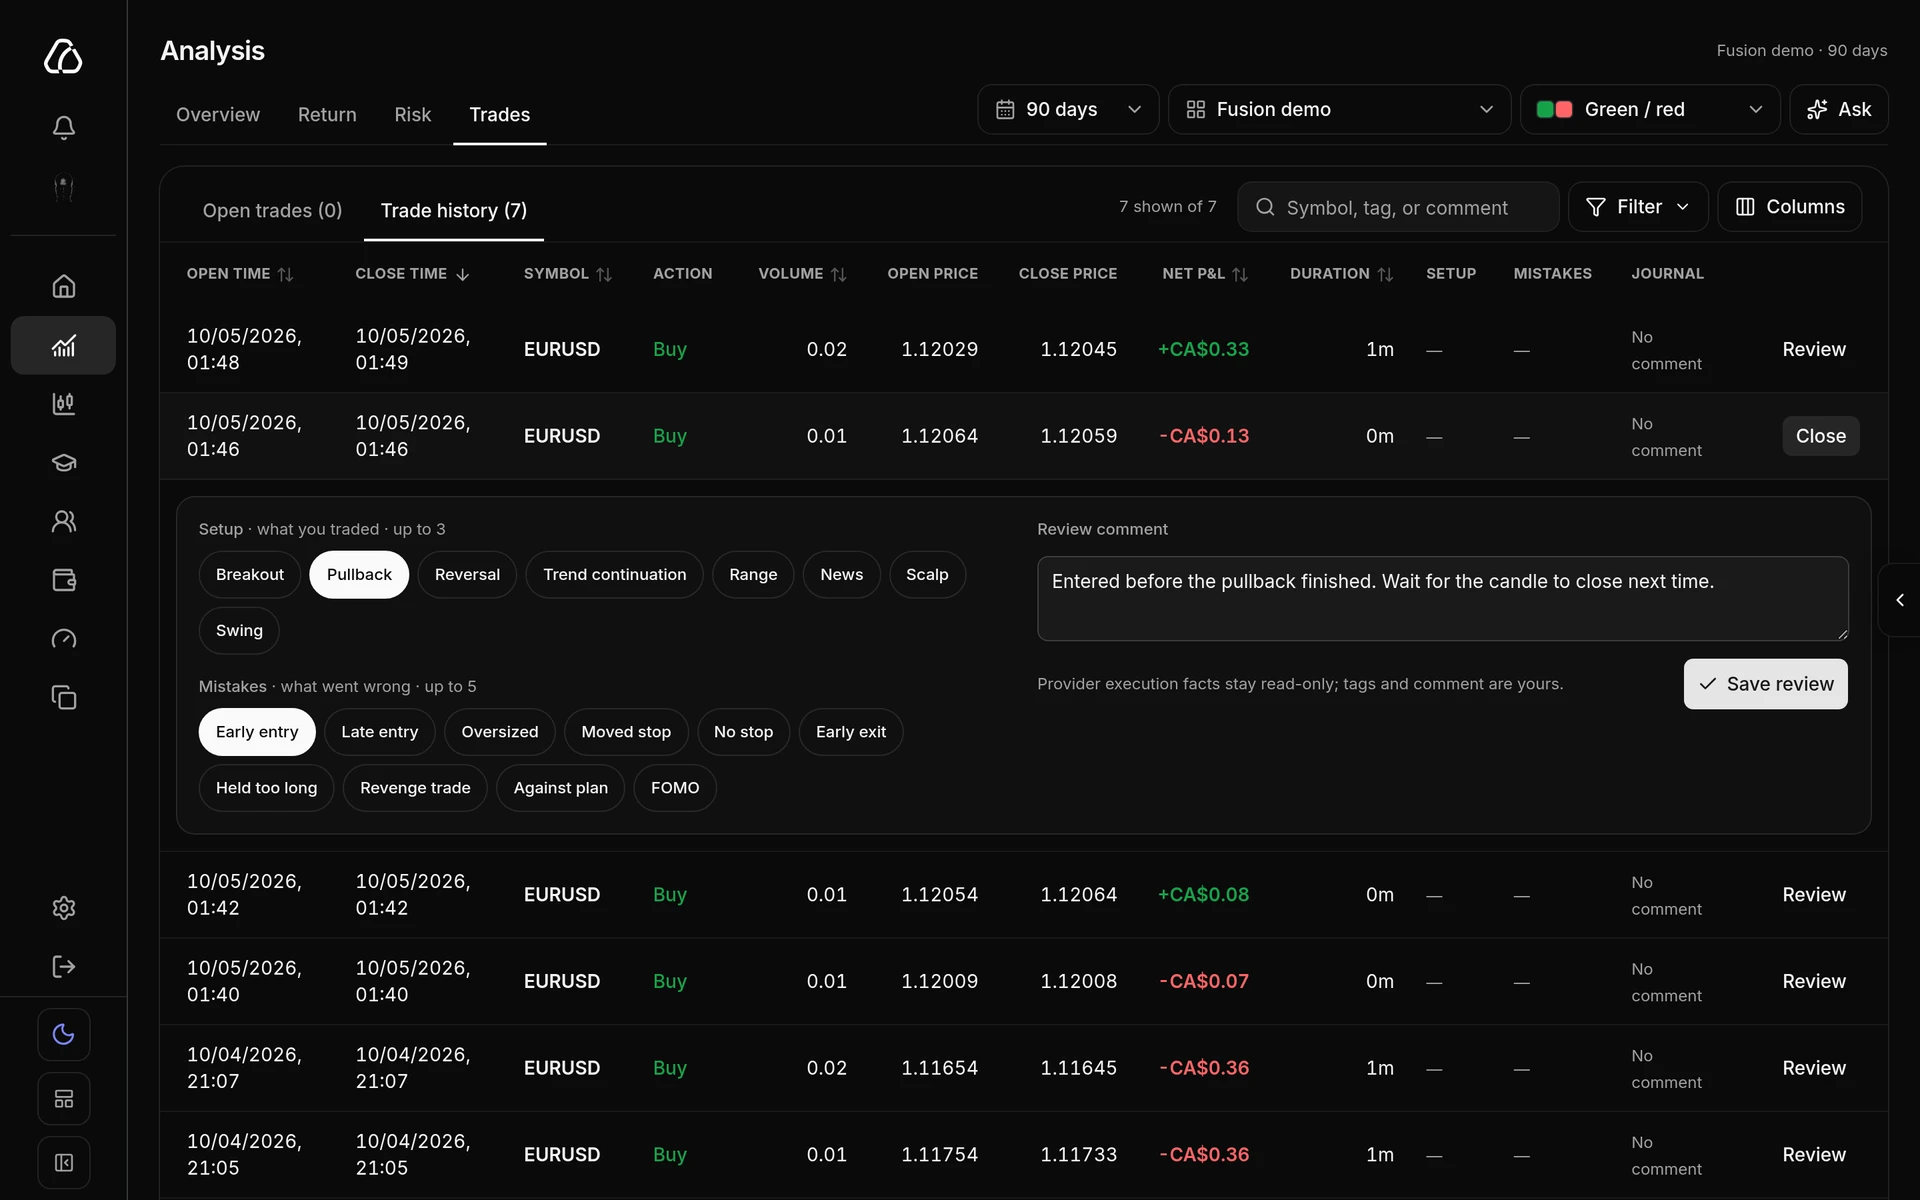
For trades that came from your connected account, the prices, size and P&L stay as your broker reported them. Only the tags and comment are yours to edit.
Ask about this scope
Ask opens a panel of questions about the account and range you’ve picked: Analyze my performance, What patterns do you see?, How is my risk management?, What are my best trades? and Where am I losing money?
Each answer opens with how many closed trades it’s based on. Below 30 closed trades, it tells you to treat every statement as an observation, not a pattern. Then come the findings, each with the metric it comes from, and Next actions, such as tagging the setup on untagged trades. The counts at the bottom show your closed trades, how many have no setup tag, how many losses have no mistake tag (Losses untagged), and how many have no review comment.
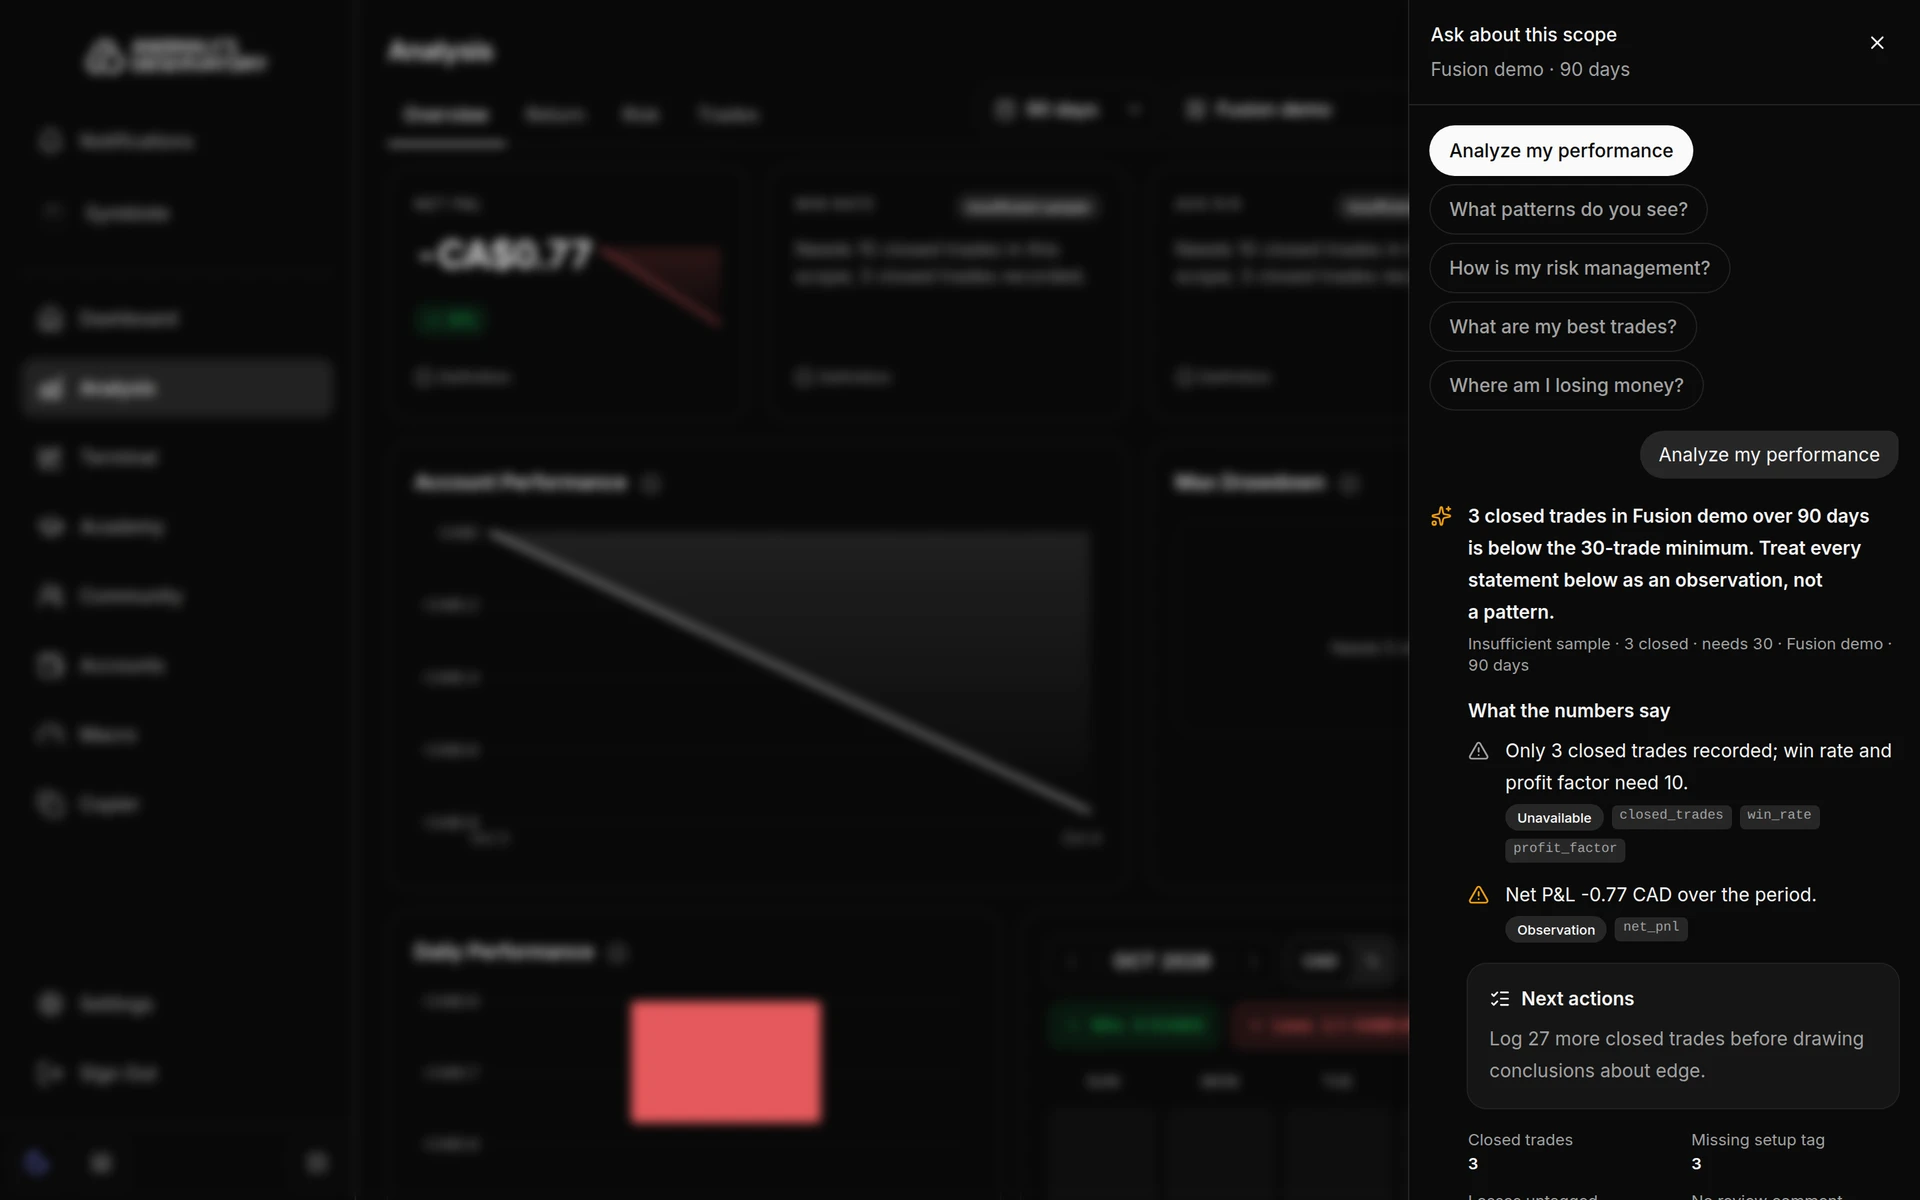
The answers are worked out from your own trades. They’re a review of the past, not advice on what to trade next.
Sample data
If AO offers sample accounts, the account picker has a Sample data (not connected) group, and an empty Analysis page shows Explore sample data. A banner reminds you that the trades are generated. Reviews you save on sample trades last until you leave the page and aren’t stored anywhere.
If the page is empty
“Nothing to analyze yet” means you have no connected accounts and no journaled trades. Connect an account with Connect Account. If a section says it has nothing for this scope and range, try a longer range or All accounts. Opening Analysis on a connected account also ticks the last step of the Get started checklist on your dashboard.