
Watchlist
Track live prices across your accounts and AO Market Data, organise symbols into lists and sections, and choose what each row shows.
The watchlist keeps the symbols you follow in one place, with live prices and the day’s change. Click a row to put that symbol on the chart and in the order ticket.
Open the watchlist
On a desktop screen the watchlist is open in the right rail when the terminal loads. Click Watchlist in the rail to close or reopen it, or click the arrow at the top right of the panel to collapse it.
On a phone, tap Open watchlist (the list icon) in the bar under the chart. The watchlist slides in from the right.
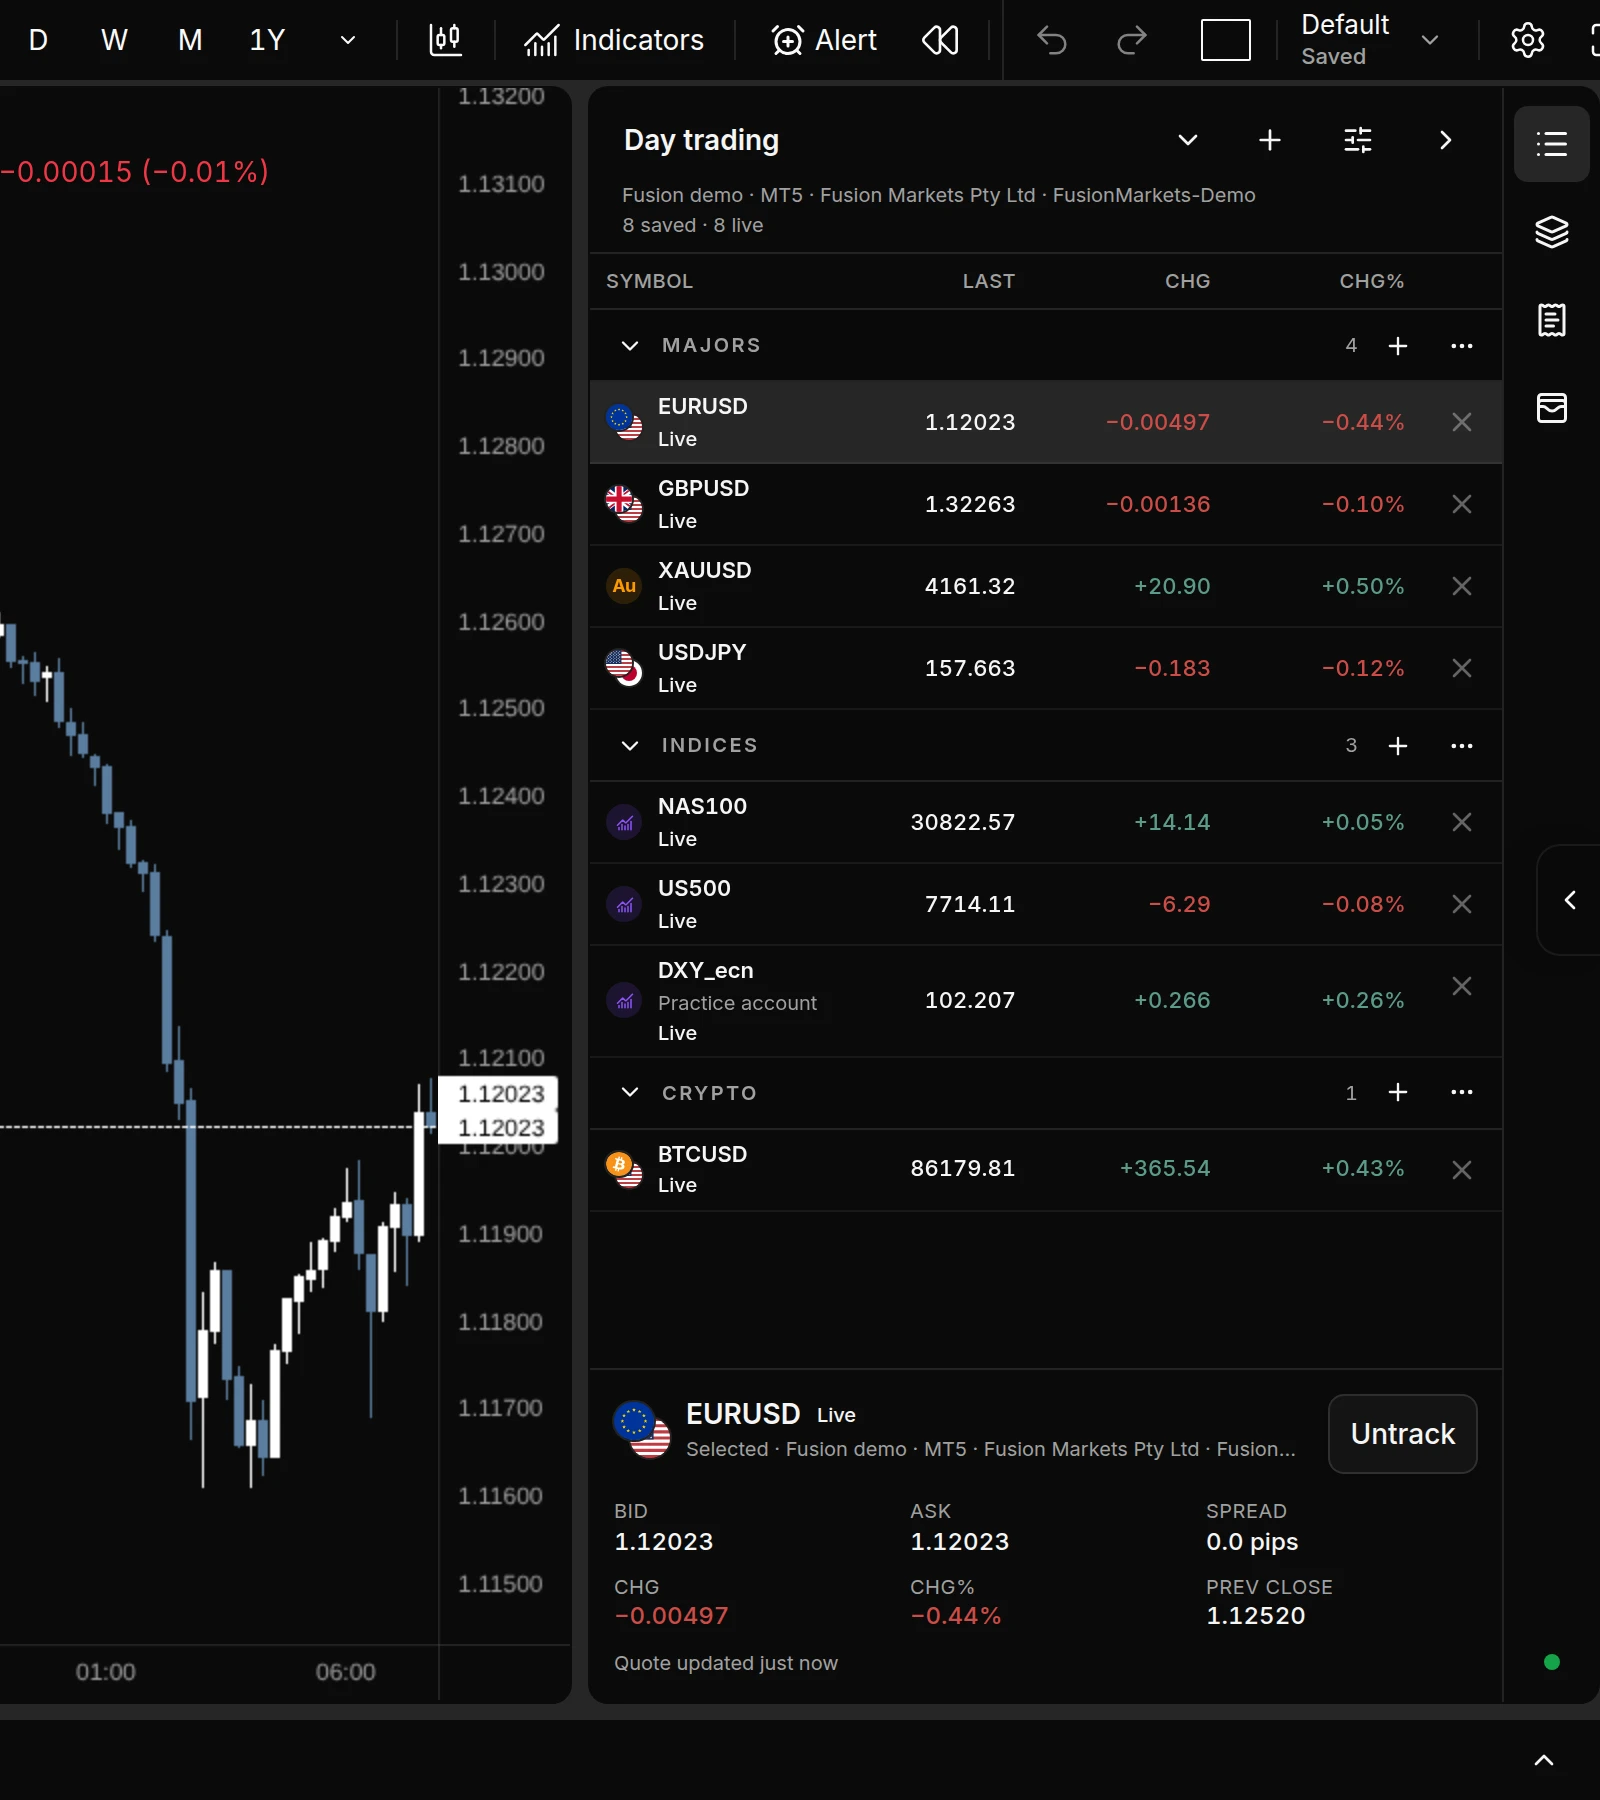
The top of the panel shows:
- the list name, which opens the list menu
- + to add a symbol, and the sliders icon for display options
- the source the chart is on, with its platform, broker and server
- a count such as 12 saved · 12 live
At the bottom, a summary card shows the selected symbol’s Bid, Ask, Spread, Chg, Chg% and Prev close, and when its quote last updated.
Read a row
Each row shows the instrument logo, the symbol, its quote status and your chosen columns. Chg and Chg% compare the live price with the previous session’s close. Gains show in green and losses in red.
If a row belongs to a different source from the one the chart is on, the source’s name appears under the symbol. Clicking that row switches the terminal to that source and selects the symbol.
The status under each symbol tells you how far to trust the price:
| Status | Meaning |
|---|---|
| Live | Prices are streaming. |
| Waiting | No quote has arrived yet, or the source is still connecting. |
| Closed | The quote session for this symbol is closed, for example at the weekend. AO Market Data rows follow the same market hours as broker rows. |
| Stale | No new quote for a minute or more, or three minutes for AO Market Data rows. Hover it to see how long the price has been quiet. |
| Reconnecting | The feed dropped and is reconnecting. |
| Unavailable | The source doesn’t offer this symbol, or it isn’t connected. |
| Paused | The row is saved but not streaming, because 20 other rows already are. |
Add a symbol
-
Click + at the top of the watchlist. To add straight into a section, click the + on that section’s header instead.
-
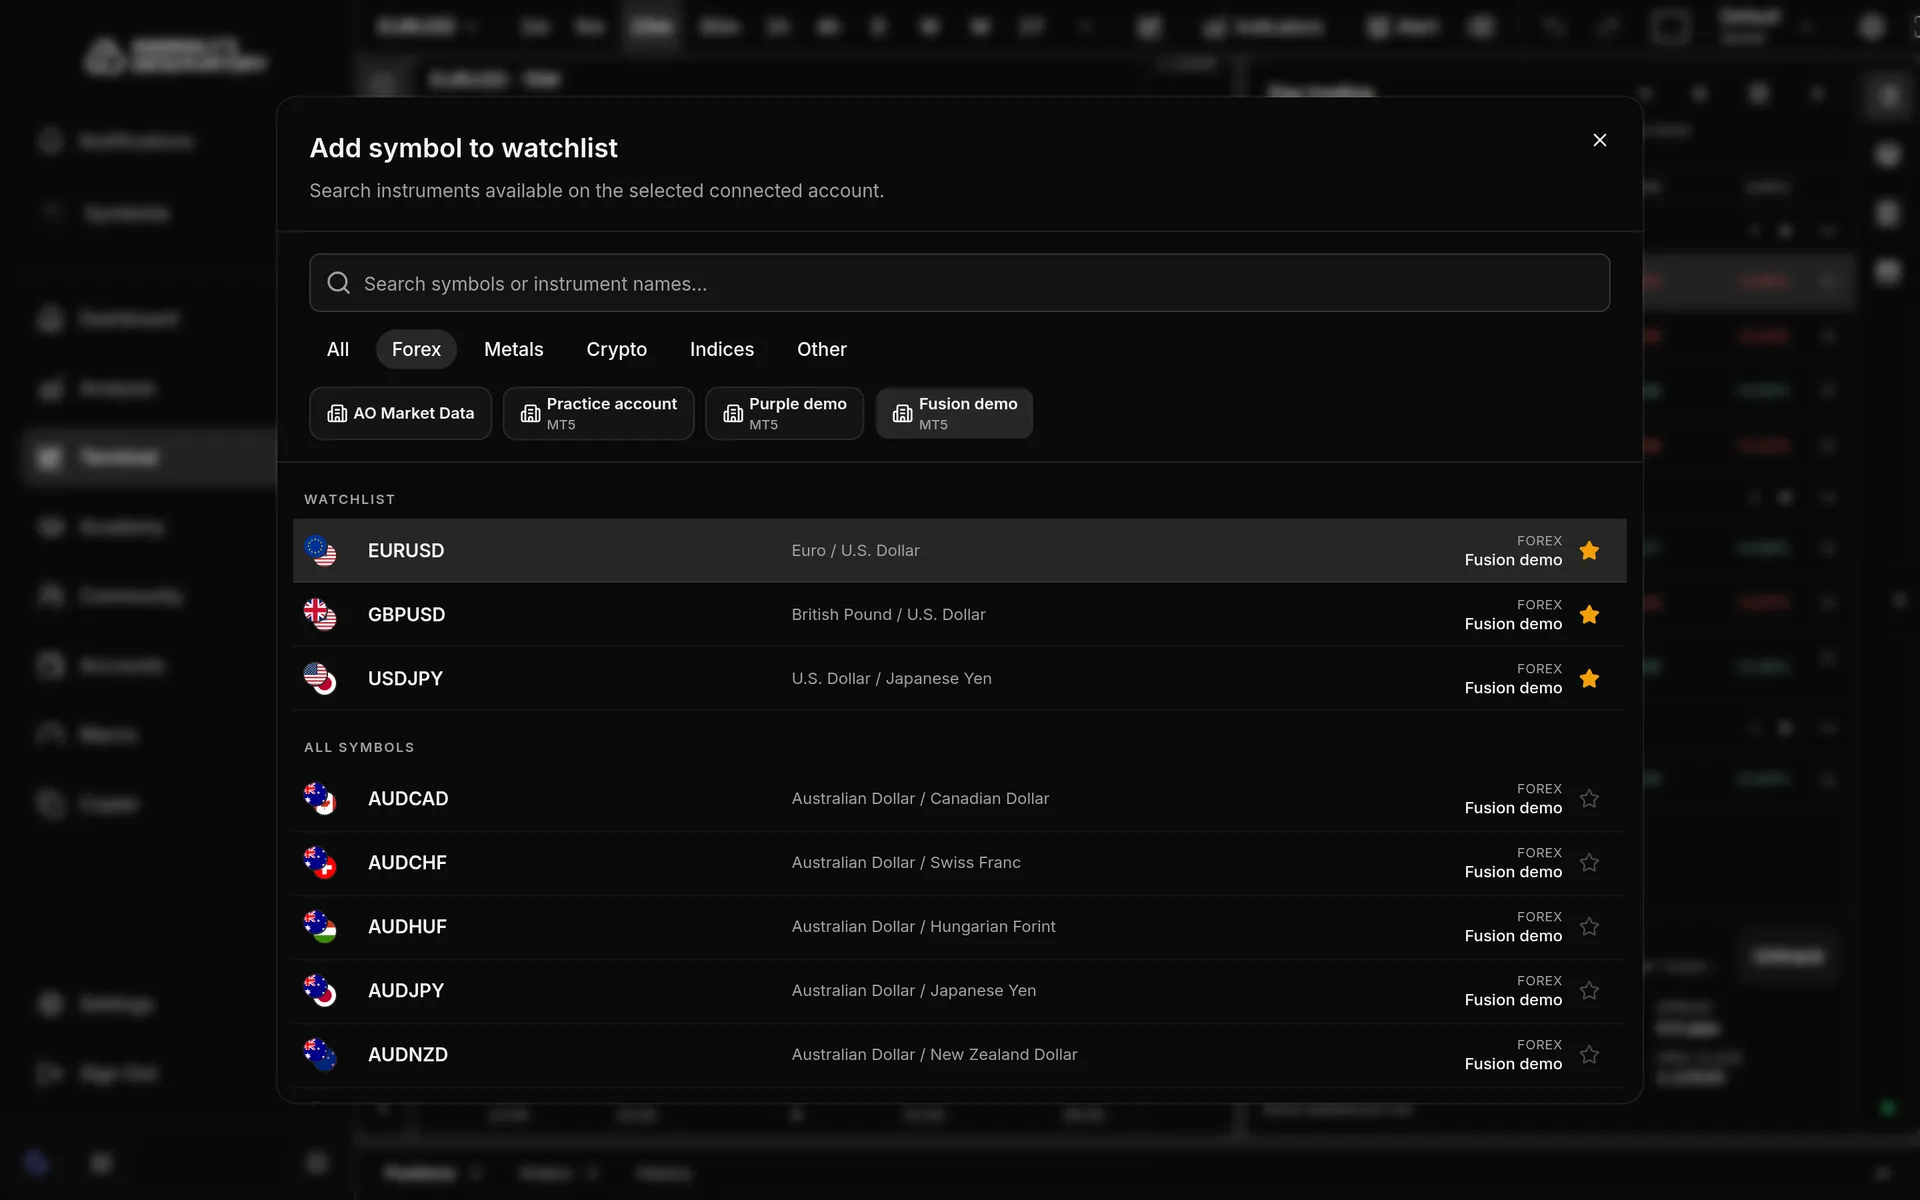
In Add symbol to watchlist, pick the source you want the price from. The buttons list AO Market Data and each connected account.
-
Search, or filter with All, Forex, Metals, Crypto, Indices and Other.
-
Click the star on a row to add it and keep the dialog open for more. Clicking the row itself adds the symbol and closes the dialog. If the symbol is on the chart’s current source, the chart switches to it too.
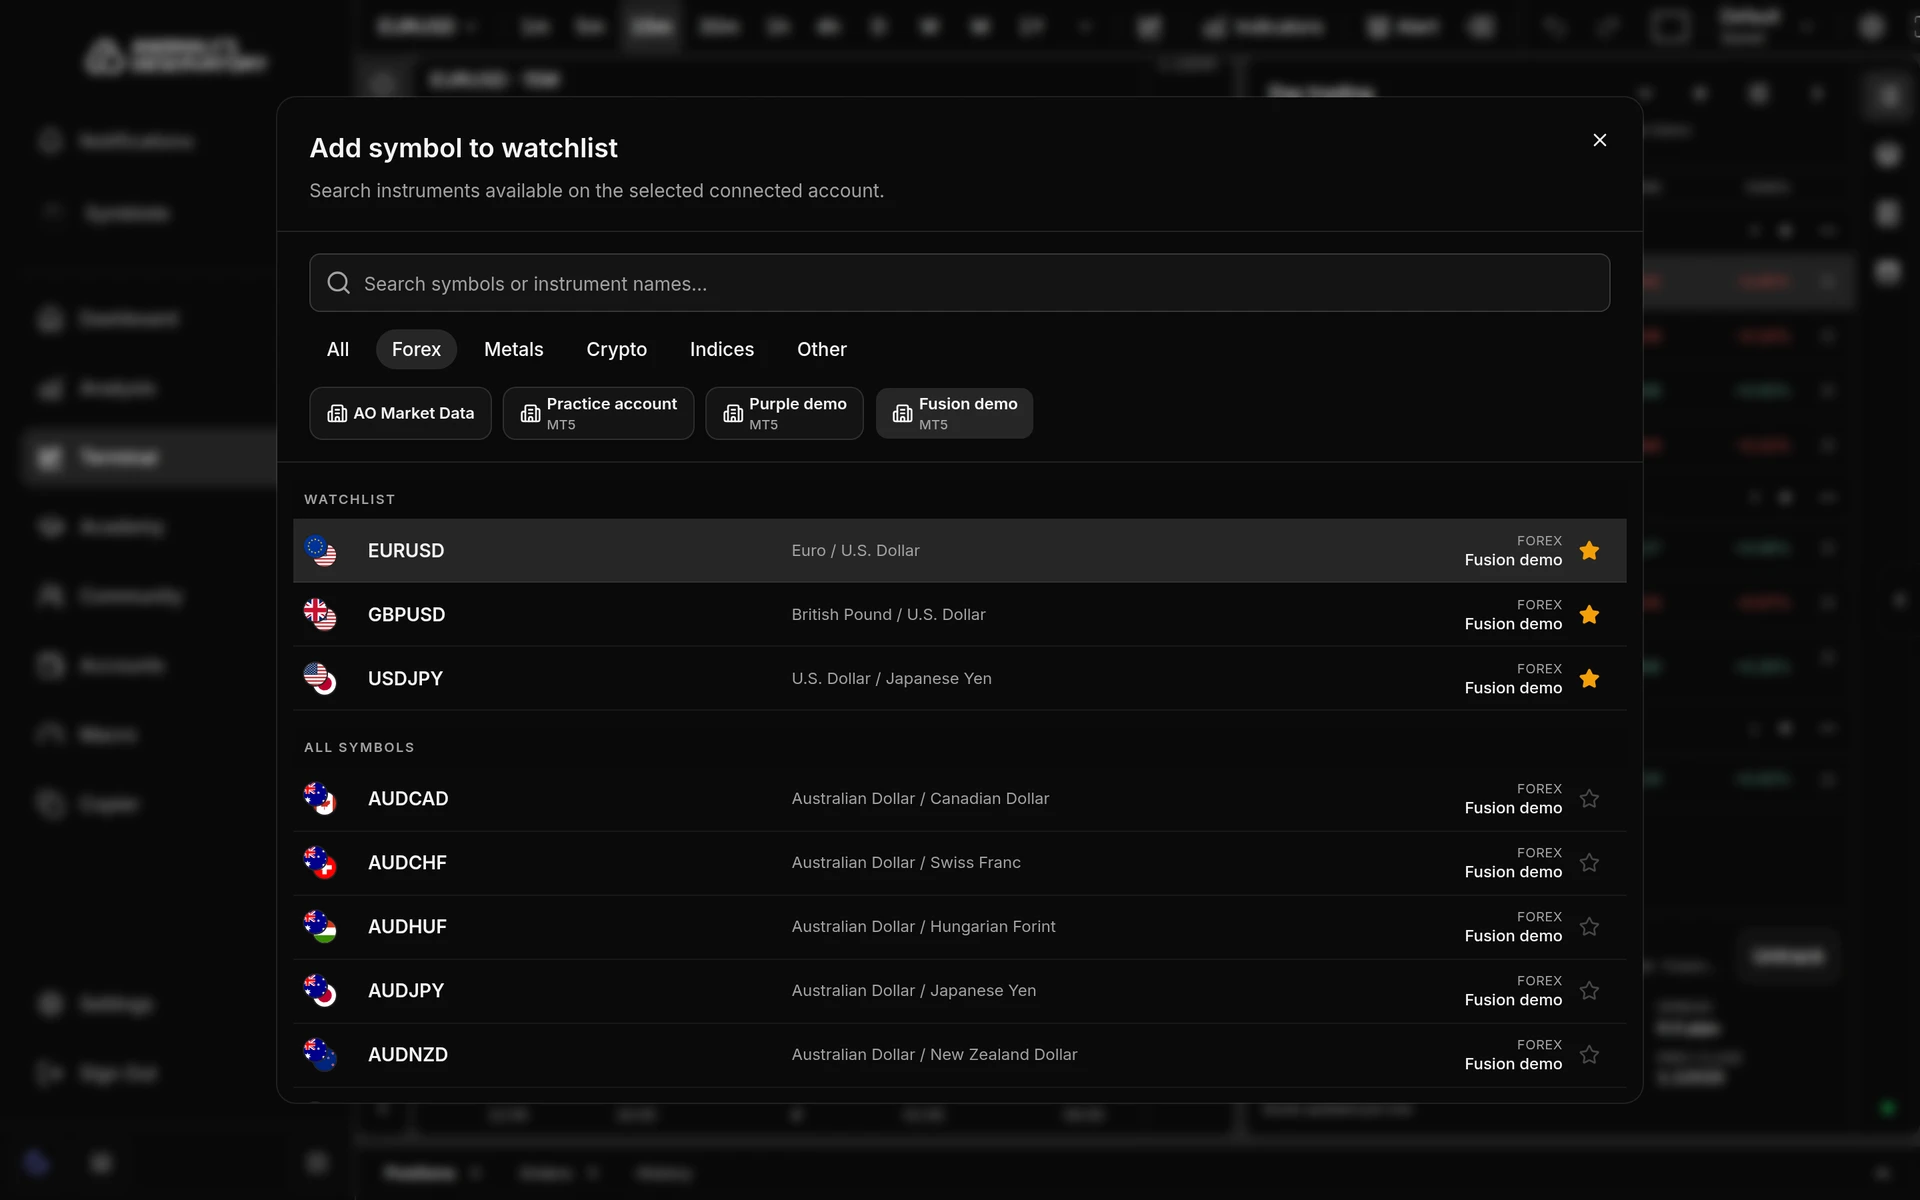
You can also add the symbol that’s on the chart. Click Track on the summary card at the bottom of the watchlist, or click the star next to it in symbol search.
A list holds up to 20 symbols from each source. Up to 20 rows stream live prices at once. Rows past that show Paused.
Remove or move a symbol
- Hover a row and click the × at its right end.
- Or select the symbol and click Untrack on the summary card.
- Or click its filled star in symbol search.
There’s no drag-and-drop ordering. New symbols go to the end of their section. To move a symbol to another section, open that section’s + and pick the symbol again: it leaves its old section and goes to the end of the new one.
Lists and sections
Click the list name at the top left to open the list menu.
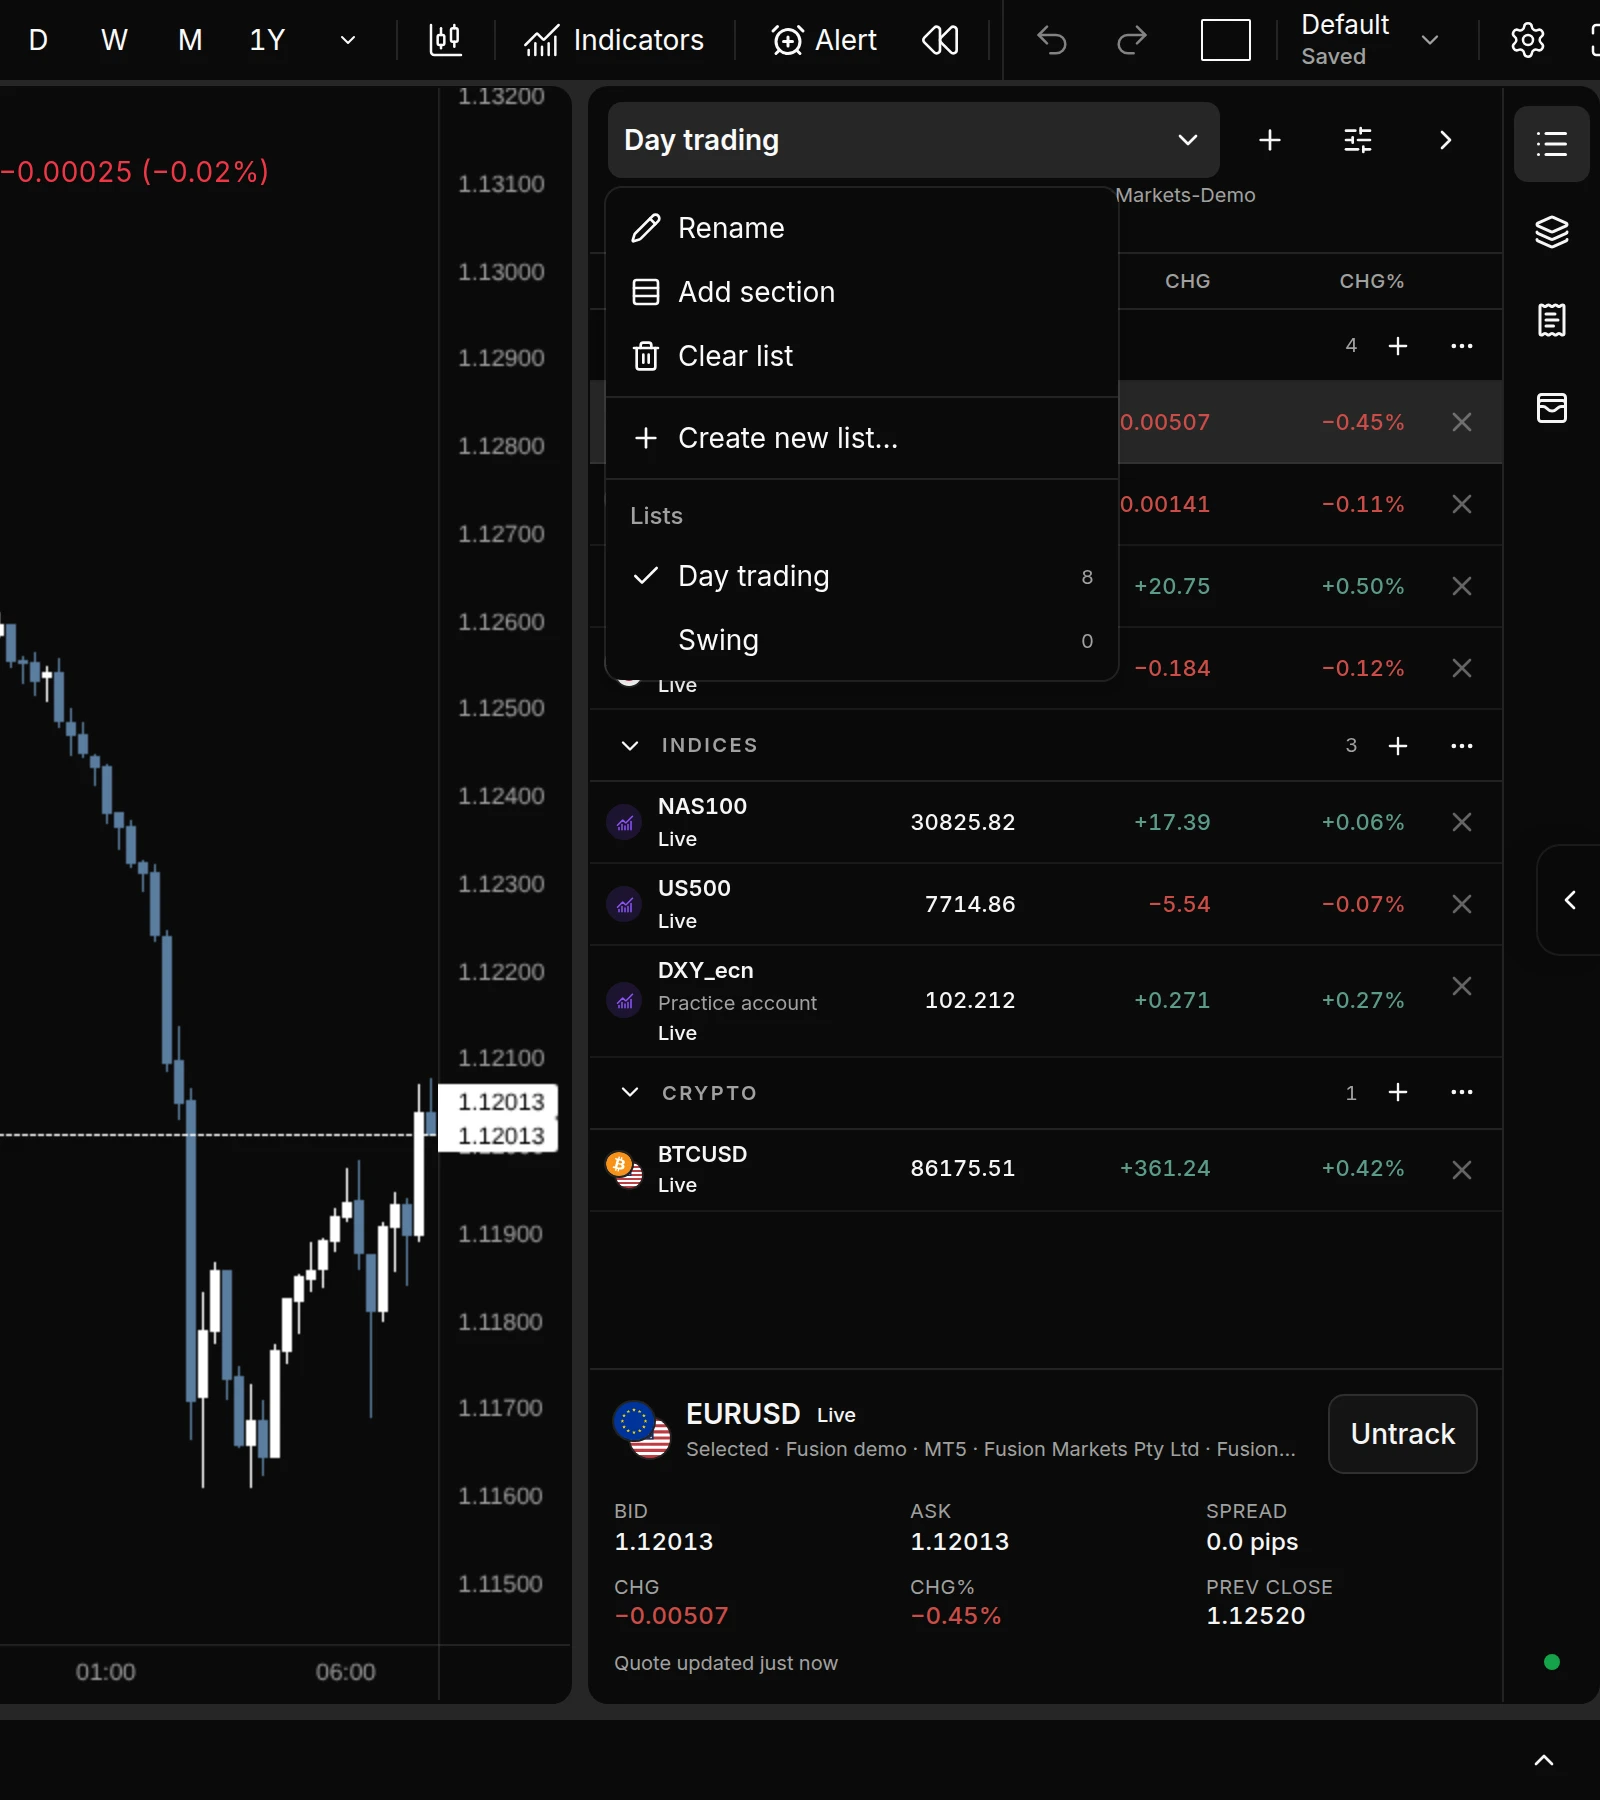
- Rename renames the current list.
- Add section adds a heading to group related symbols in this list.
- Clear list removes every symbol and keeps the list and its sections.
- Create new list… starts another list. A list can mix symbols from any of your sources.
- Under Lists, click a list to switch to it. The number beside each is how many symbols it holds.
Each section header has an arrow to collapse it, a symbol count, a + to add symbols to it, and a menu with Rename section.
You can keep up to 12 lists with up to 24 sections each. Lists and sections can’t be deleted: Clear list empties a list, and Rename lets you reuse it. Lists, sections and symbols are saved to your account, so they’re the same on every device.
Prices from more than one source
A list can mix AO Market Data with any of your connected accounts. AO Market Data rows and rows on the chart’s own account always quote. For other broker accounts, the terminal connects the first four accounts that appear in the list, counting from the top. Rows from any account after that show Unavailable until you switch the chart to it.
Choose what each row shows
Click the sliders icon at the top of the watchlist.
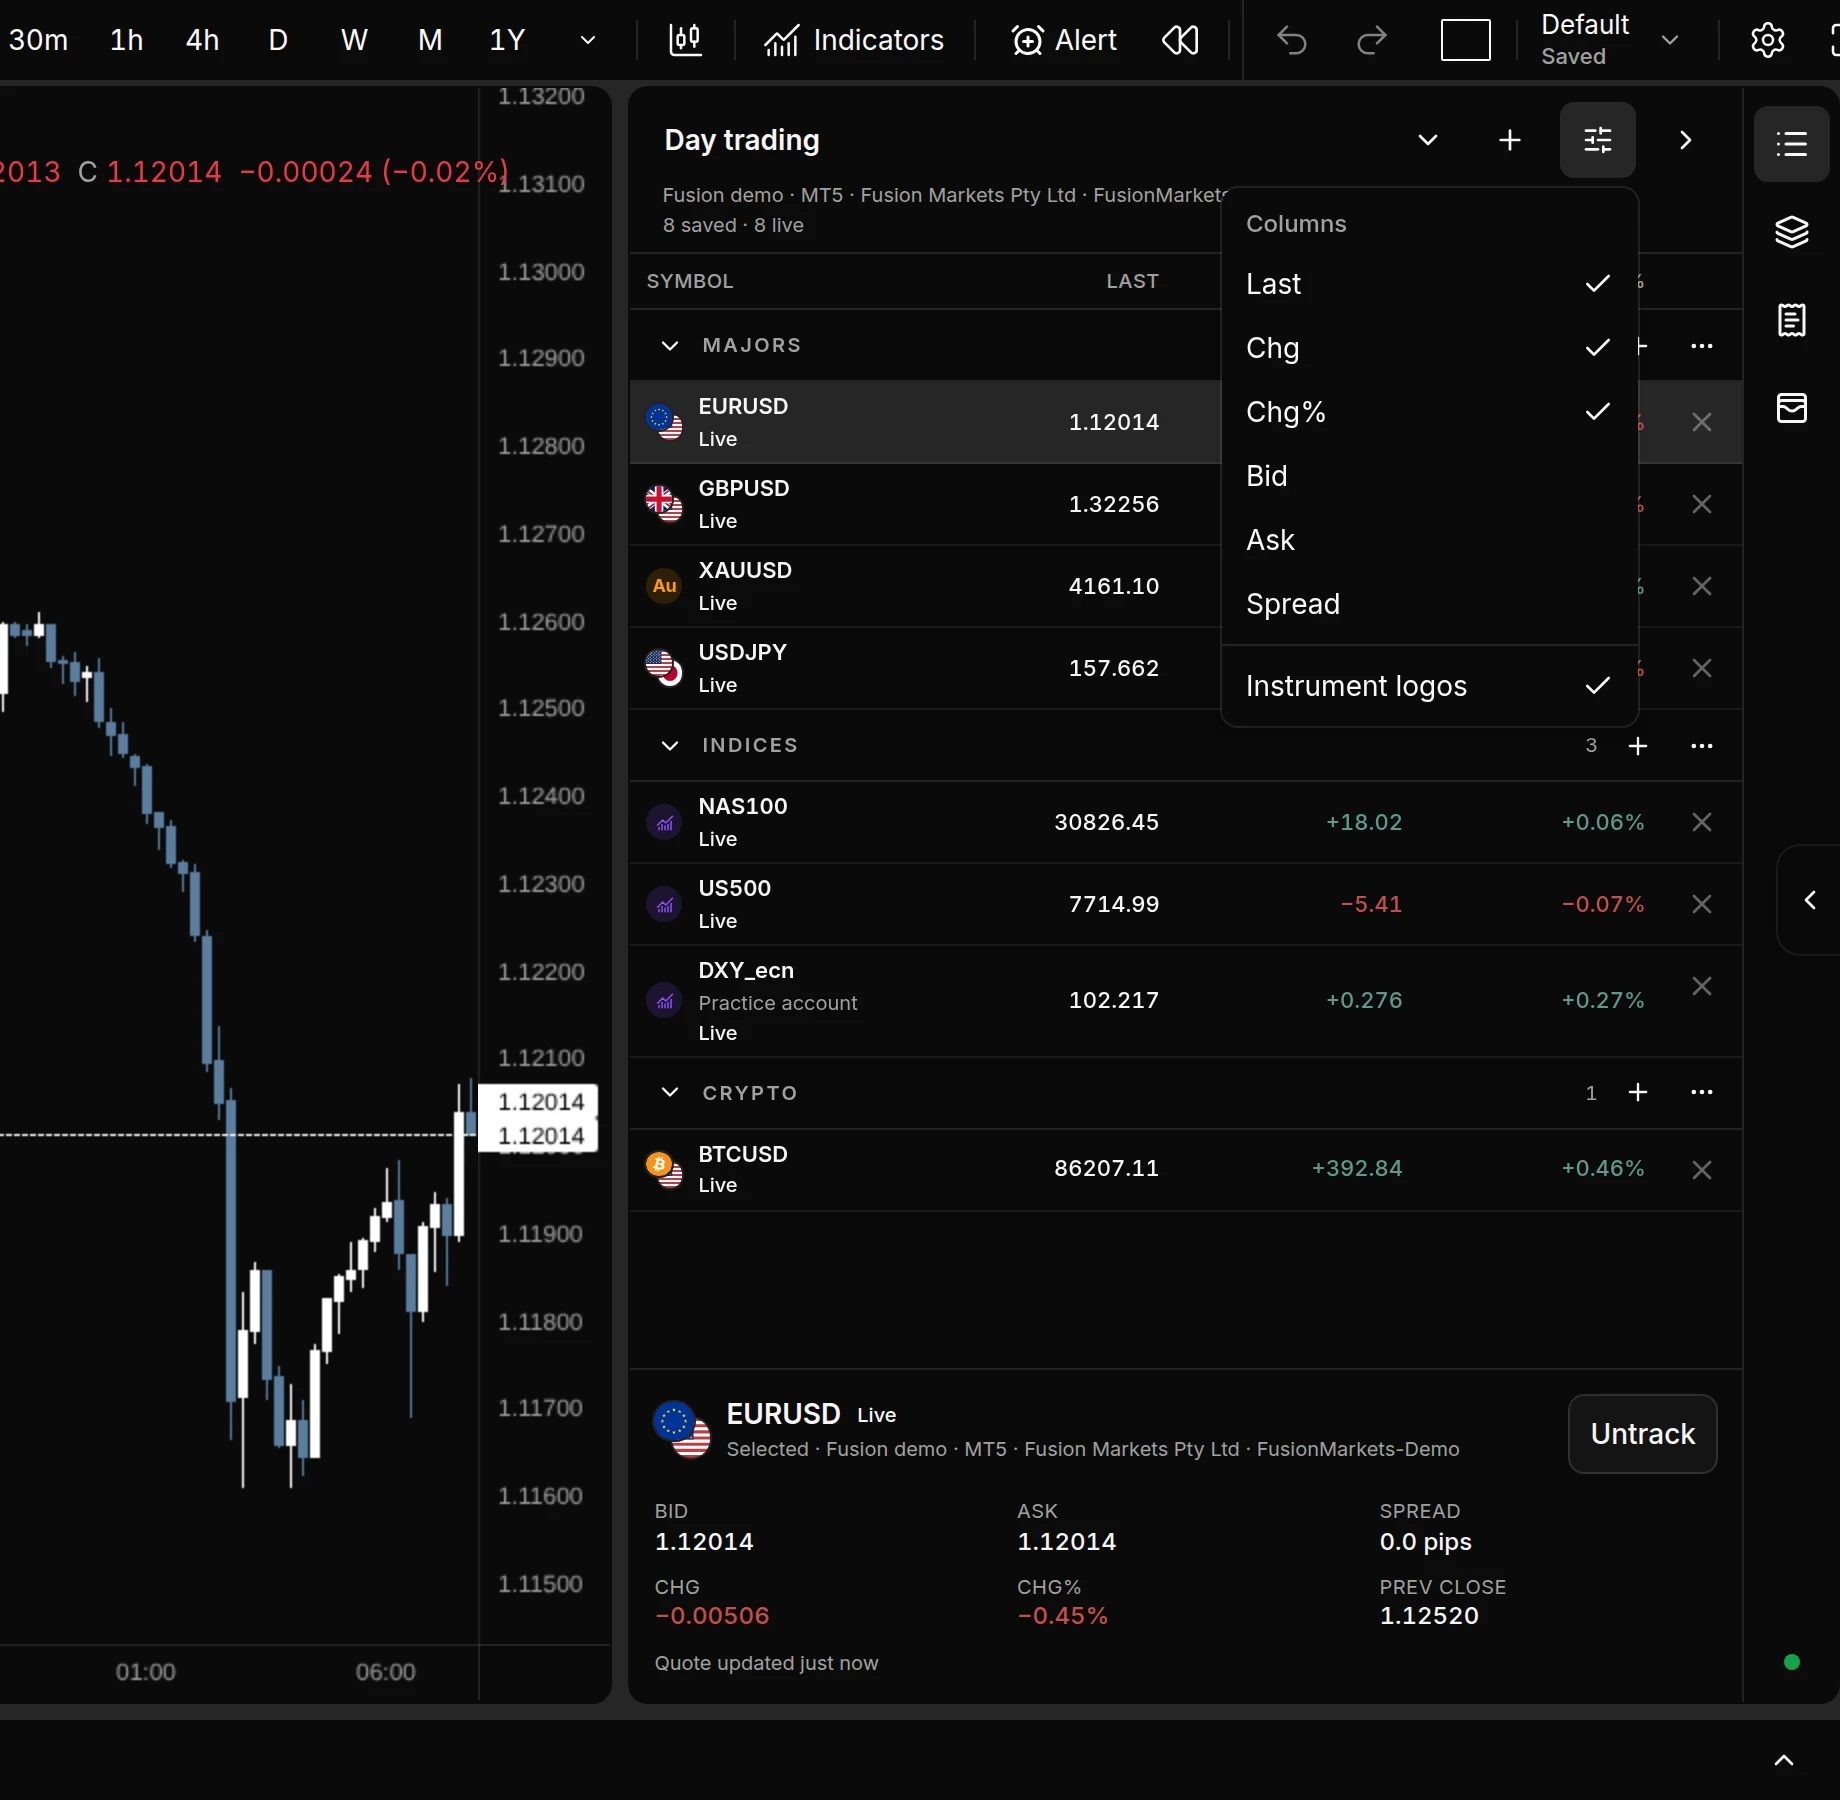
- Under Columns, tick any of Last, Chg, Chg%, Bid, Ask and Spread. Last is the current bid. Spread is in pips where the symbol’s pip size is known.
- Instrument logos shows or hides the flag, coin or brand mark next to each symbol.
When the panel is narrow, only Last, Chg and Chg% fit, and the summary card shows the symbol and Track only. Drag the panel wider to see the rest. Your choices are saved to your account.
On a phone
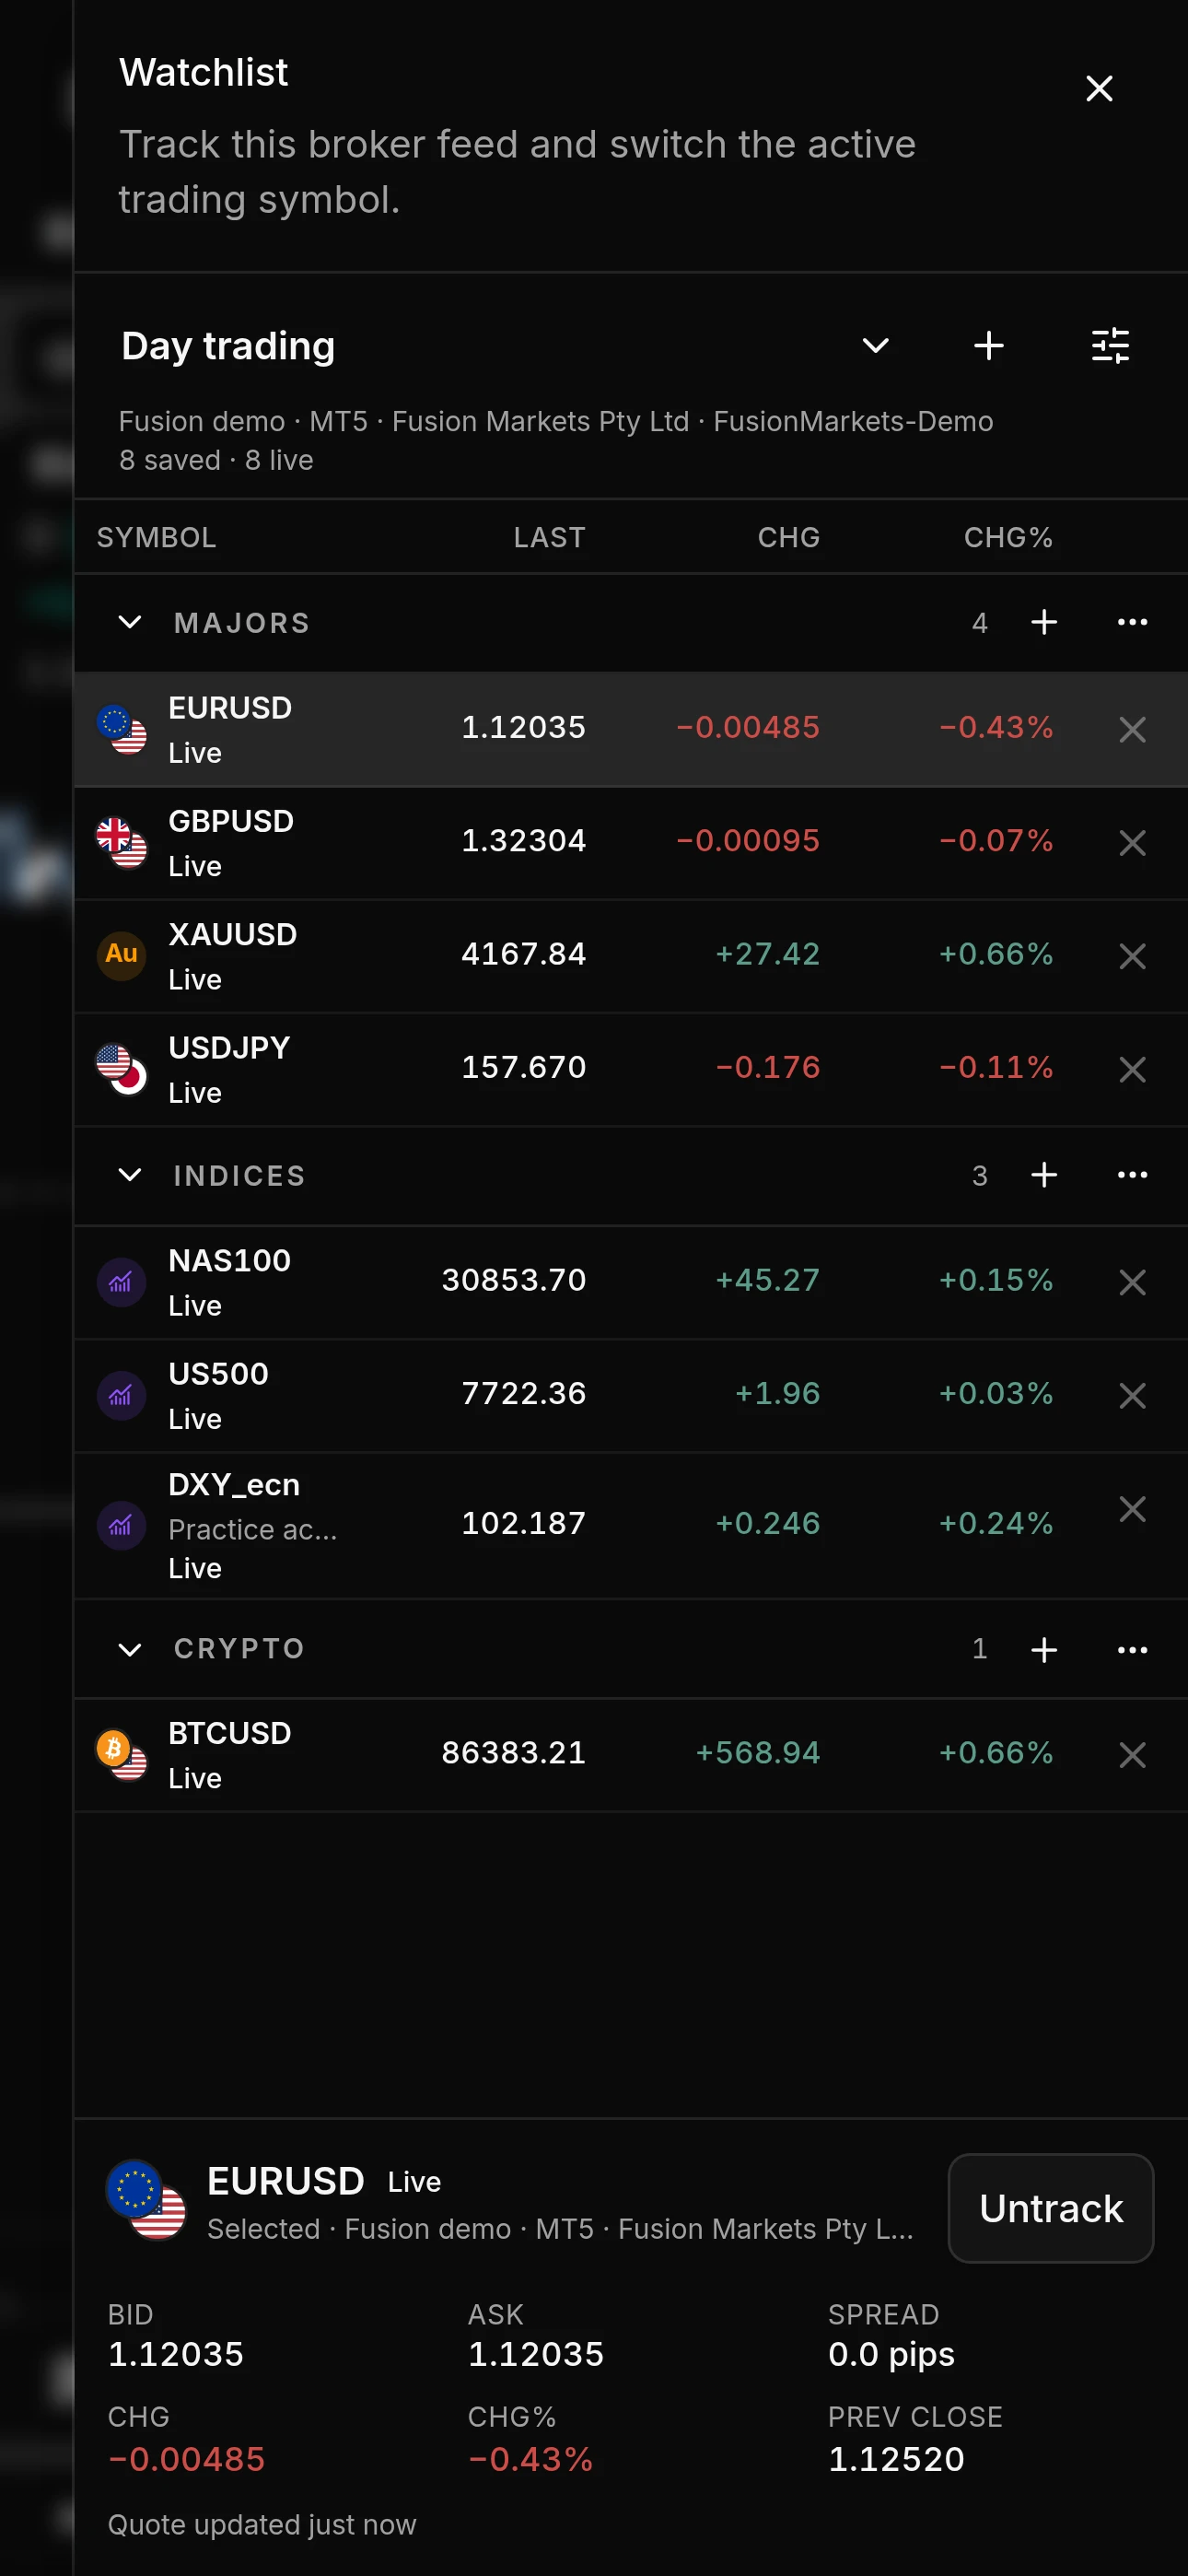
The watchlist opens as a sheet over the chart. Tap a row to chart it, then close the sheet to get back to the chart.