
Drawing tools and the object tree
Draw lines, shapes, Fibonacci levels, notes and measurements on the chart, then organise, hide, lock and delete them from the object tree.
Drawings mark up the chart with levels, zones and notes. They’re saved to your account per symbol, so a level you draw on EURUSD shows on every EURUSD chart, in every layout, on every device.
Drawing a trend line from the Lines menu, a horizontal line with Shift+H, then opening the object tree.
The drawing toolbar
The drawing toolbar runs down the left edge of the chart. In a multi-chart layout it sits beside the active chart. On a phone, tap Show drawing tools under the chart to bring it up.
From the top:
- Pointer mode picks the cursor: Cross, Dot or Arrow. Choosing one also drops any drawing tool you had picked.
- Six tool groups: Lines, Shapes, Fibonacci, Annotations, Measure and Paths. Each button shows the last tool you used from that group. Click it to open the group.
- Undo and Redo.
- Magnet mode snaps points to candle prices. See Magnet.
- Stay in drawing mode keeps a tool picked after you place a drawing, so you can draw several in a row.
- Open drawing object tree.
- Lock all drawings, Hide all drawings and Remove all drawings act on every drawing for this symbol.
- Collapse drawing toolbar shrinks the toolbar to one button. Click Expand drawing toolbar to bring it back.
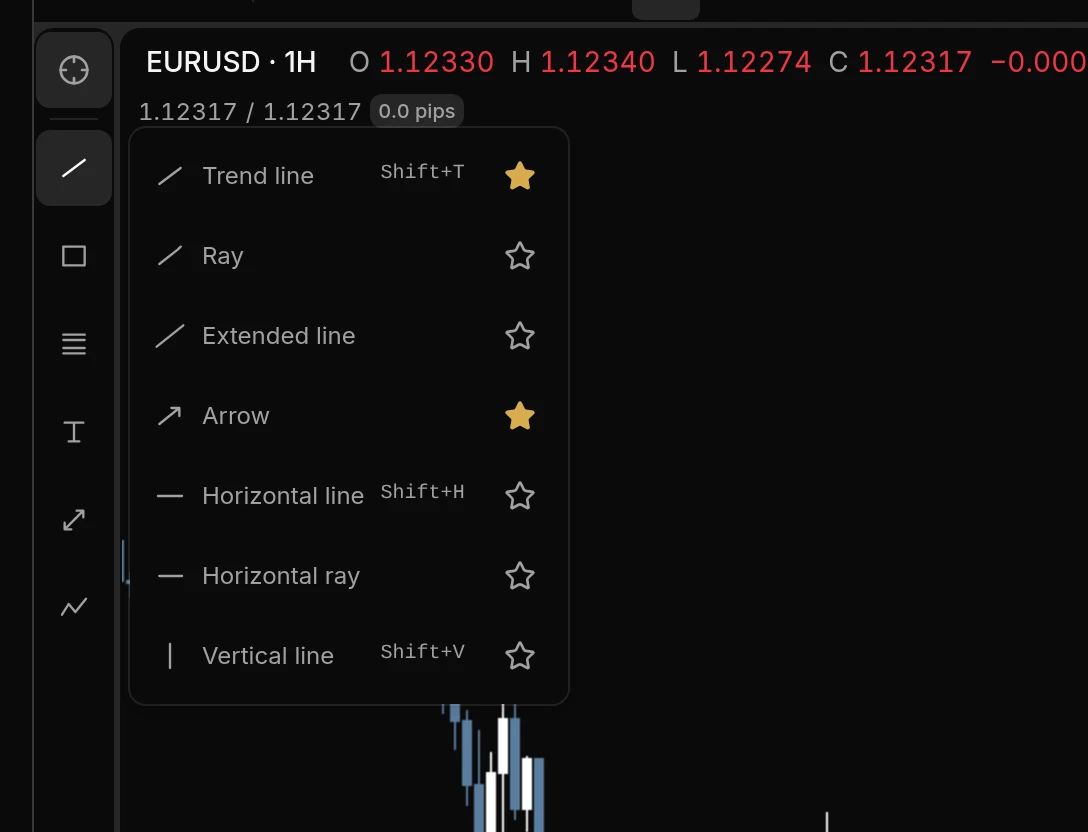
Tools
| Group | Tools |
|---|---|
| Lines | Trend line, Ray, Extended line, Arrow, Horizontal line, Horizontal ray, Vertical line |
| Shapes | Rectangle, Curve, Circle, Parallel channel |
| Fibonacci | Fib retracement |
| Annotations | Text, Arrow mark down, Arrow mark up, Price note, Note, Signpost |
| Measure | Price range, Long position, Short position |
| Paths | Path, Brush, Highlighter |
Note draws a white label with dark text and a dot at the point it’s pinned to. Callout is no longer in the list, because Note covers it. Callouts you’ve already drawn still show, and you can still select and edit them.
Long position and Short position are planning drawings. They show entry, stop, target and risk to reward on the chart, and their Inputs tab takes an account size, lot size and risk. They don’t place orders. To trade from the chart, see Set take profit and stop loss.
Draw a trend line
- Click Open Lines tools (the line icon) on the drawing toolbar and choose Trend line, or press Shift T with the pointer over the chart.
- Click where the line starts, then click where it ends. You can also press and drag from start to end.
- Hold Shift while you place the second point to lock the angle to 45° steps.
The tool puts itself down after one drawing unless Stay in drawing mode is on. Press Esc to cancel a drawing halfway.
Draw a horizontal line
- Press Shift H, or choose Horizontal line from the Lines group.
- Click the chart at the price you want. The line runs across the whole chart at that price.
Other tools follow the same pattern. A few work differently:
- Path takes a click for each point, up to 100. Press Enter or double-click to finish.
- Brush and Highlighter draw freehand while you drag, and stay picked until you choose another tool or press Esc. A single click leaves a dot. Highlighter draws a broad, see-through stroke.
- Horizontal ray, Vertical line, Text, Arrow mark up, Arrow mark down, Signpost, Long position and Short position need one click to place.
- Text, Note, Price note and Signpost open their settings on the Text tab once placed, with the cursor in the text box, so you can type straight away.
- Parallel channel and Curve take a third click, for the channel’s width or the curve’s bend.
Magnet
Click Magnet mode on the drawing toolbar and choose:
- Off: points go exactly where you click.
- Weak magnet: a point snaps to the nearest candle’s open, high, low or close when you click within about 12 pixels of it.
- Strong magnet: a point always snaps to the closest open, high, low or close of the nearest candle.
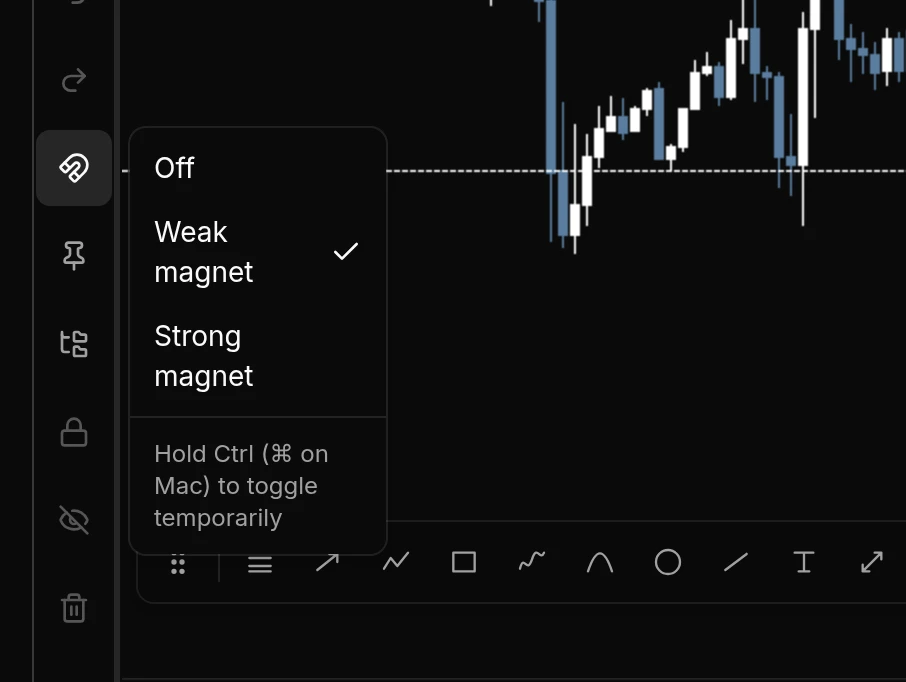
While a tool is picked and the magnet is on, the crosshair snaps to the same open, high, low or close, so it shows where your click will land. The same goes for dragging a drawing’s handle.
Hold Ctrl (⌘ on a Mac) while drawing to flip the magnet for that point: on when it’s off, off when it’s on. The menu reminds you of this under the three options. The magnet only snaps over loaded candles, never in the empty space to the right of the last bar.
Measure without drawing
To check a move without leaving a drawing behind, make sure no drawing tool is picked, then hold Shift and drag across the chart. A price range follows the pointer, showing the change in price, percent and pips, plus the number of bars and the time between the two points, such as 29 bars, 1d 5h. It disappears when you let go.
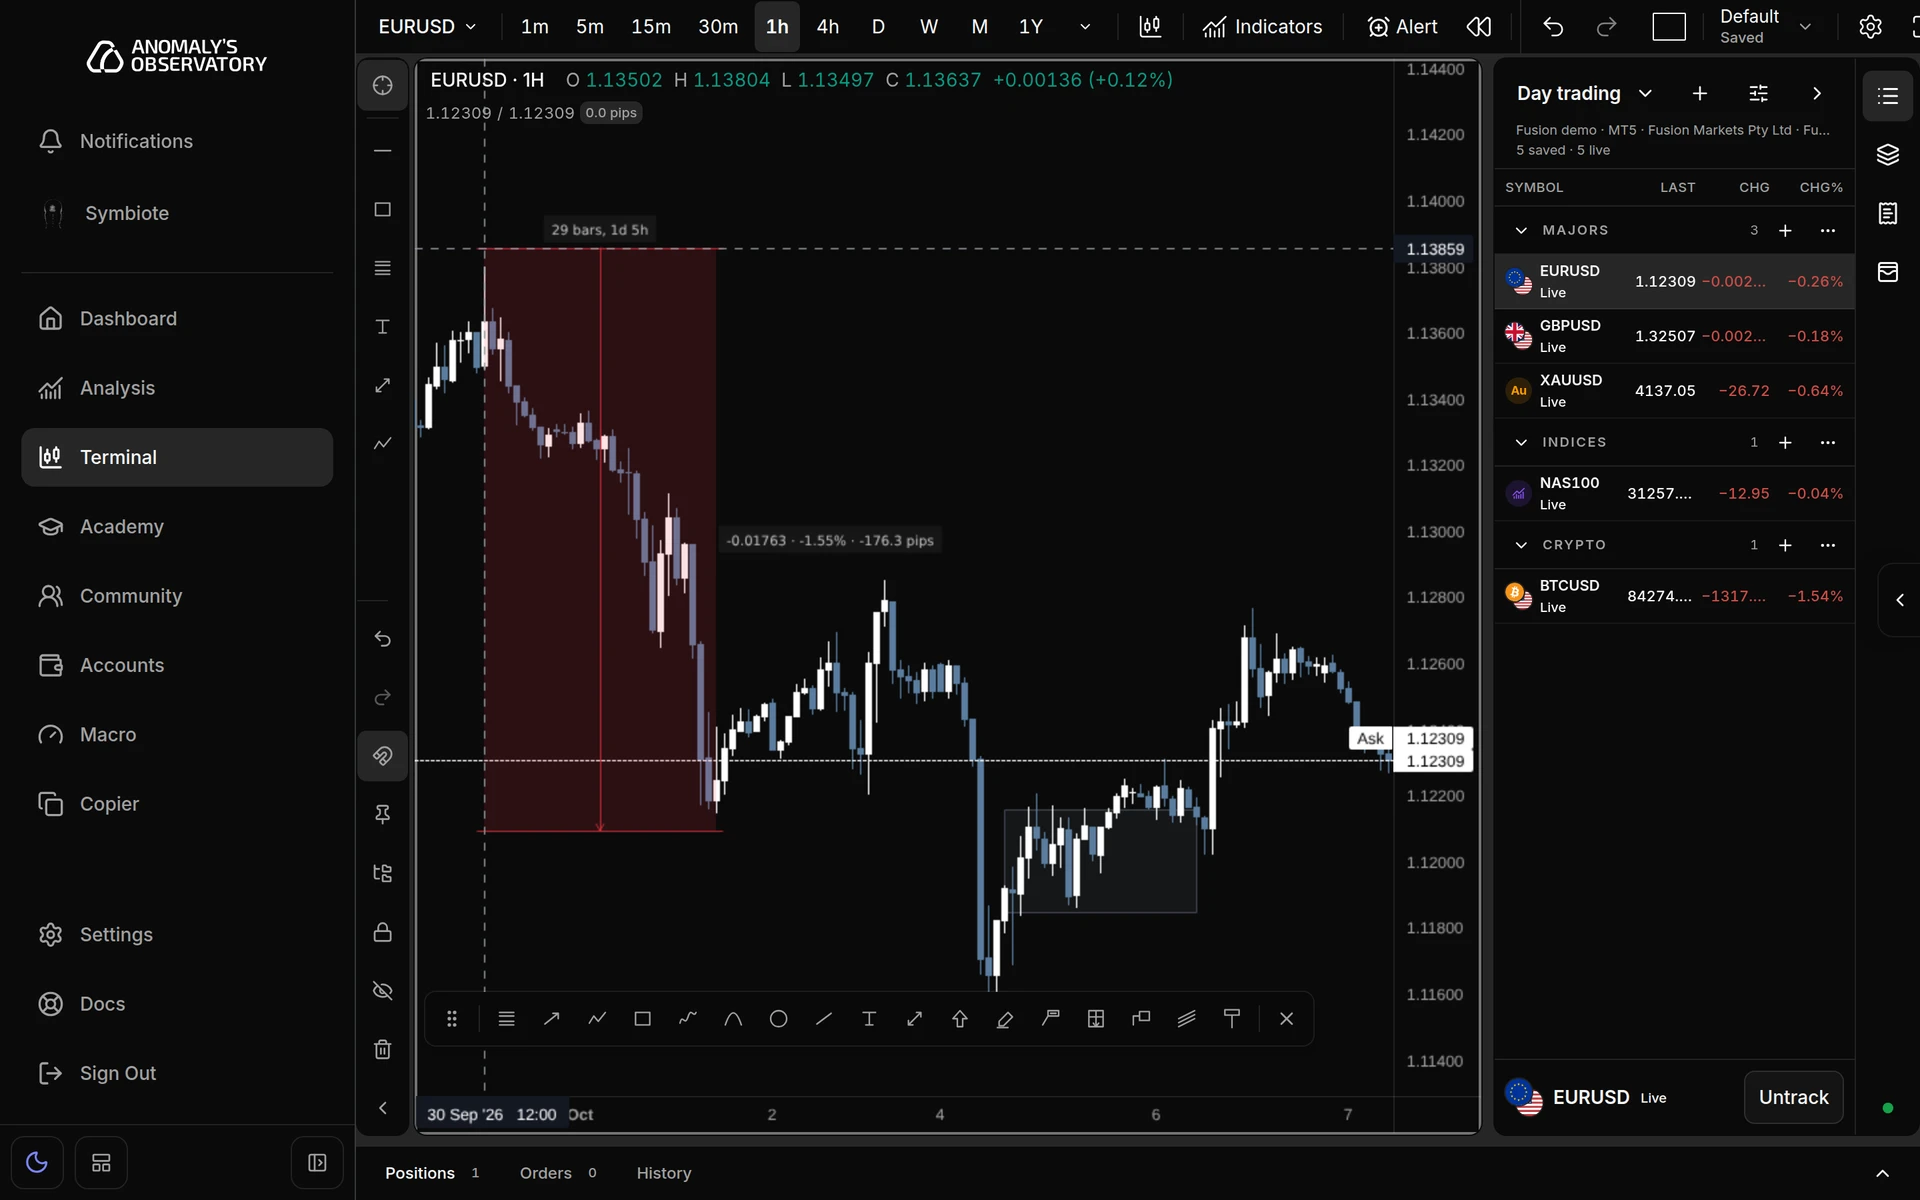
To keep the measurement on screen while you look, hold Shift and click instead of dragging. It follows the pointer until you click again or press Esc. To keep a measurement on the chart, draw a Price range from the Measure group.
The quick drawing toolbar
A floating bar at the top left of the chart holds your favourite tools. Drag its handle (Move toolbar) to place it anywhere on the chart. Drag a tool along the bar to reorder it.
To add or remove a favourite, open a tool group and click the star beside a tool. To hide the bar, click its × (Hide toolbar). Bring it back with Show quick drawing toolbar on the drawing toolbar.
Edit a drawing
Click a drawing to select it. A selected drawing keeps its own line weight and shows its handles, and hovering a drawing shows its handles faintly. Drag the handles to reshape it, or drag the line or body to move it. When drawings overlap, a click picks the one nearest the pointer, and thin lines are easy to catch from a few pixels away. A small toolbar appears near the top of the chart with:
- Drawing style, for quick colour and line changes. Click Apply to keep them.
- Drawing settings, which opens the full settings panel.
- Clone drawing, Lock drawing, Hide drawing and Delete drawing.
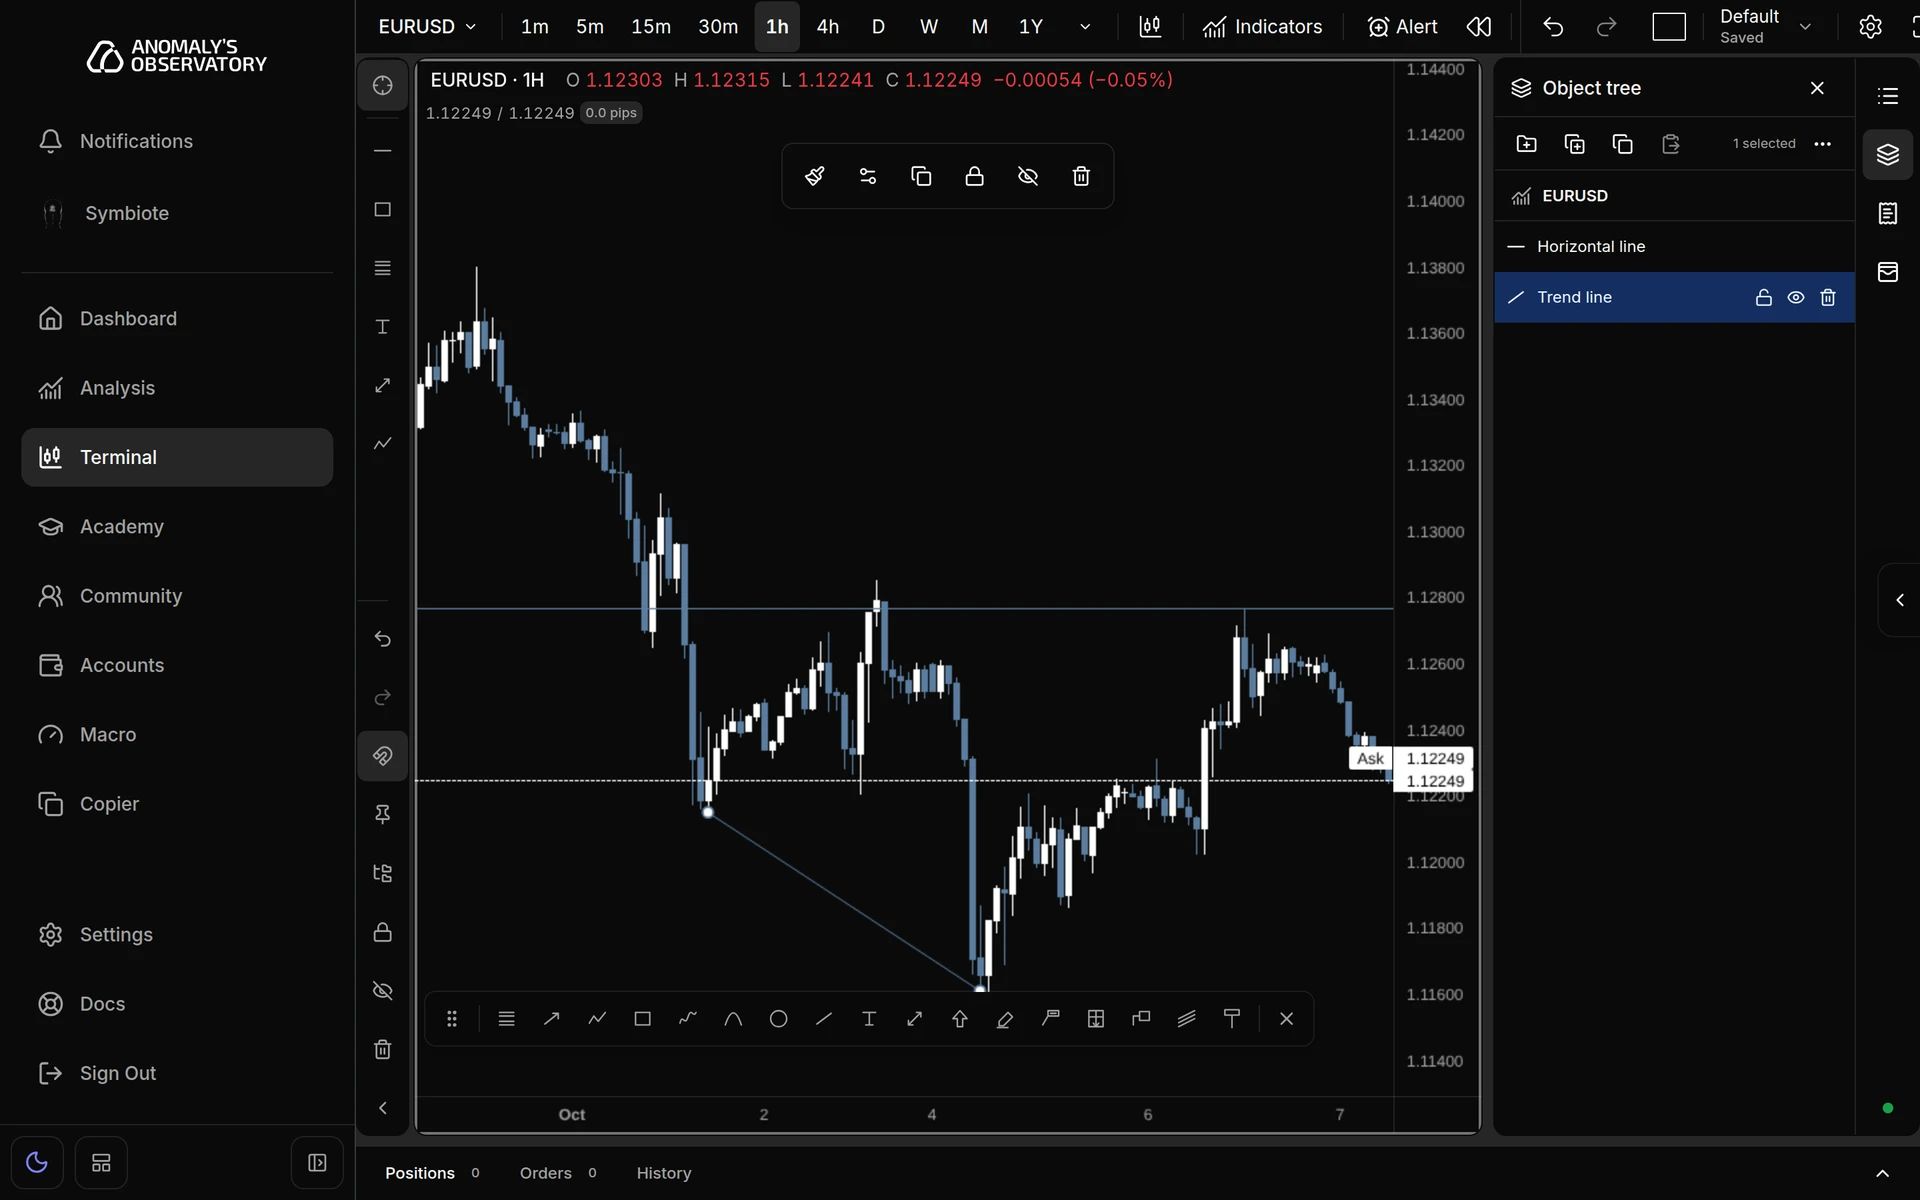
With a drawing selected, the arrow keys nudge it one bar sideways or one price step up or down. Delete or Backspace removes it, and Esc clears the selection.
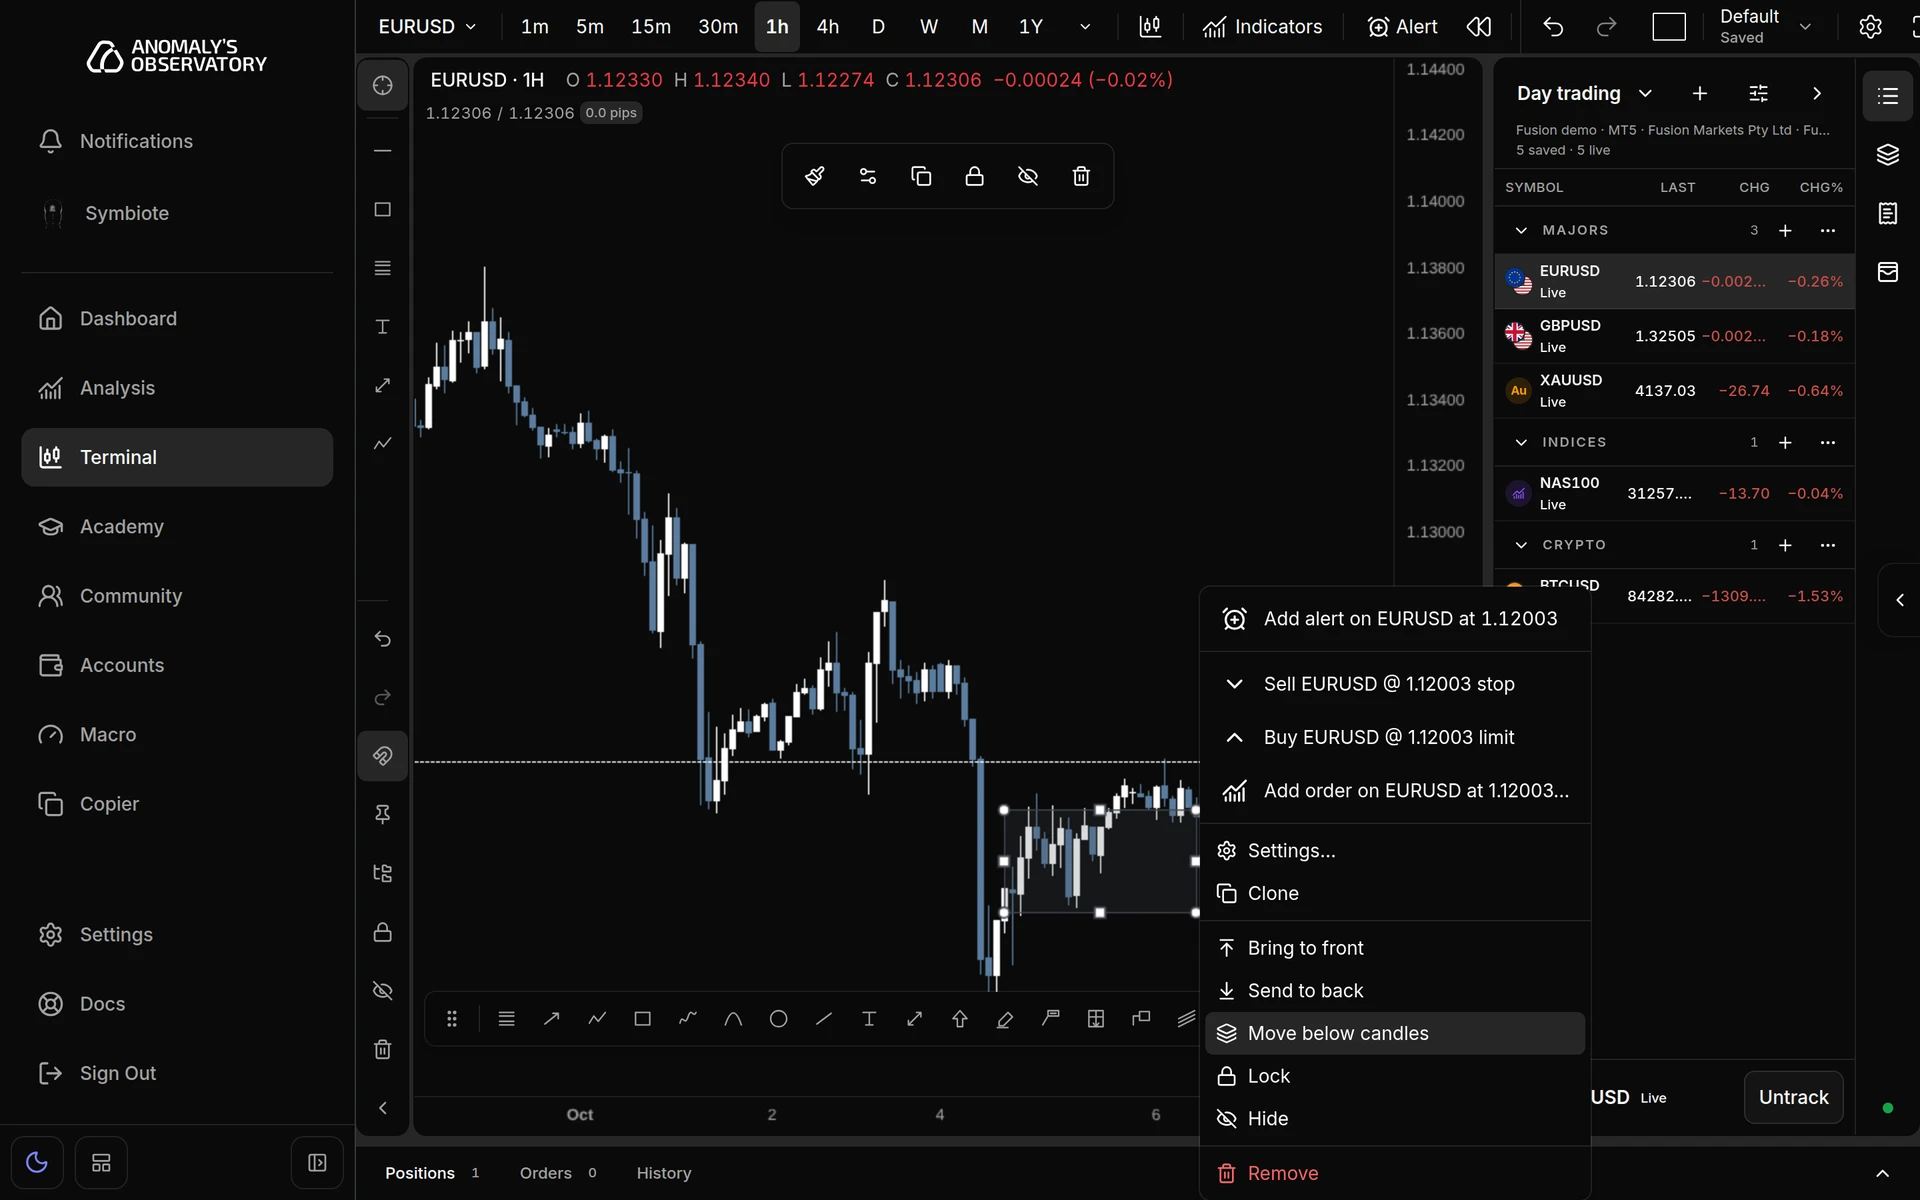
Right-click a drawing for Settings…, Clone, Bring to front, Send to back, Move below candles or Move above candles, Lock or Unlock, Hide and Remove.
Put a drawing behind the candles
Drawings sit in front of the candles to begin with. A filled zone, such as a rectangle marking a range, can hide the candles inside it. To keep the candles readable, right-click the drawing and choose Move below candles. Move above candles brings it back to the front. You’ll also find this as the Below candles box on the drawing’s Visibility tab, and under Visual order when you right-click the drawing in the object tree.
Drawing settings
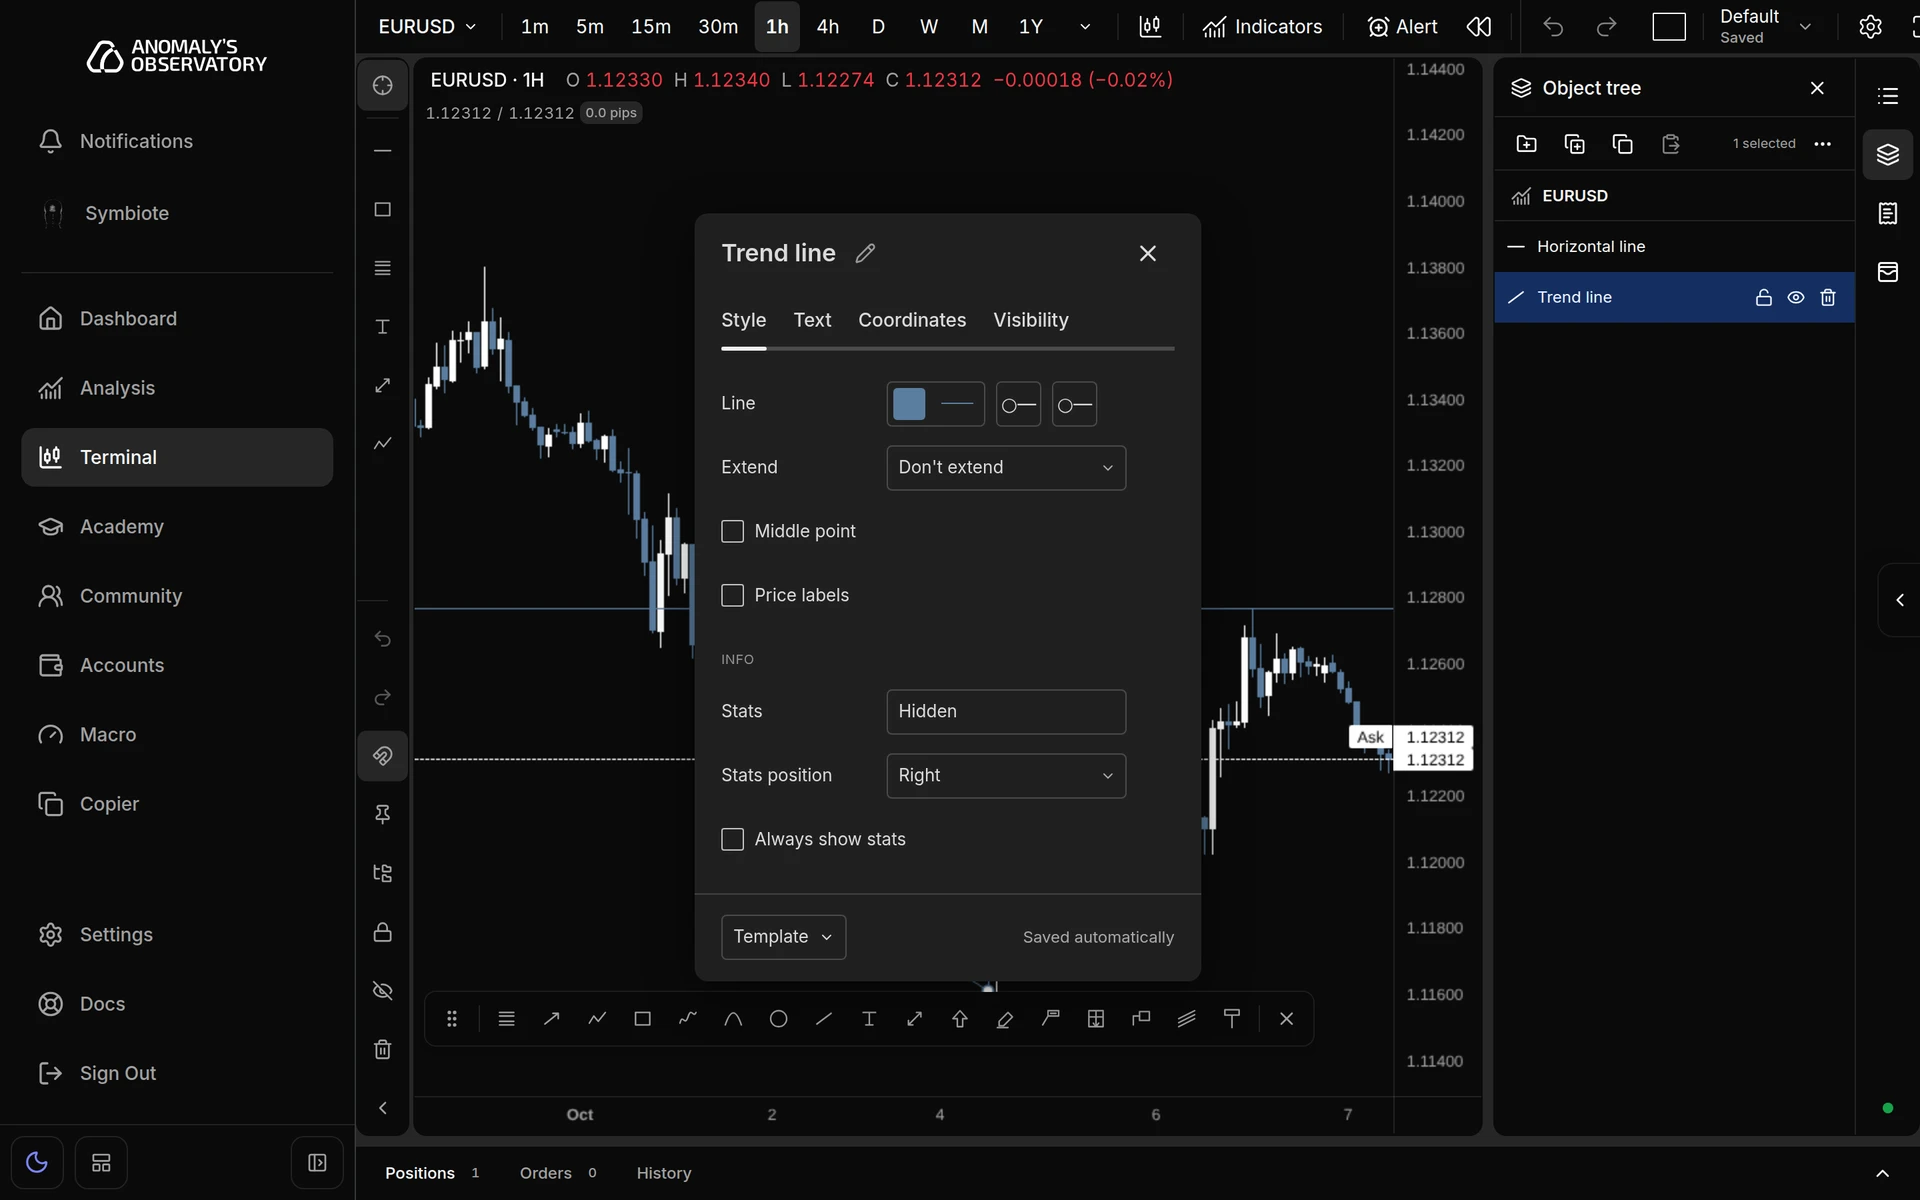
The tabs depend on the tool. Most drawings have Style, Text, Coordinates and Visibility, and position tools add Inputs. Changes save as you make them, and the footer shows Saved automatically. Click the pencil next to the name (Rename drawing) to rename it.
- Line style is picked from icons for solid, dashed and dotted lines.
- Clicking a Coordinates field selects its whole value, ready to copy or type over.
- Visibility chooses which intervals the drawing shows on. For example, you can keep a daily level off your seconds and minute charts. Its Below candles box puts the drawing behind the candles.
Click a colour to open the palette. The Brand row at the top holds the app’s own colours. To add your own, click +, pick a colour or type its hex code, and click Add. Colours you add are saved to your account, so they’re in the palette on every device.
Styles for new drawings
A new drawing starts with the last style you gave that tool. Restyle one Fib retracement, for example, and the next Fib retracement you draw looks the same. Moving, renaming or editing a drawing’s text doesn’t change the style it passes on.
The Template menu at the bottom has:
- Save as… to save these settings as a named template.
- Apply defaults to reset the drawing to its tool’s defaults.
- Reset to factory so new drawings with this tool use the built-in style again. Your existing drawings and templates are kept.
- Save as default to make this drawing’s settings the default for new drawings of the same tool.
- Your saved templates. Click one to apply it.
The Template menu closes when you click anywhere else in the panel.
The object tree
The object tree lists every drawing and indicator on the current symbol, front to back. Open it in any of these ways:
- Click Object tree in the right rail (desktop).
- Click Open drawing object tree on the drawing toolbar.
- Right-click the chart and choose Object tree.
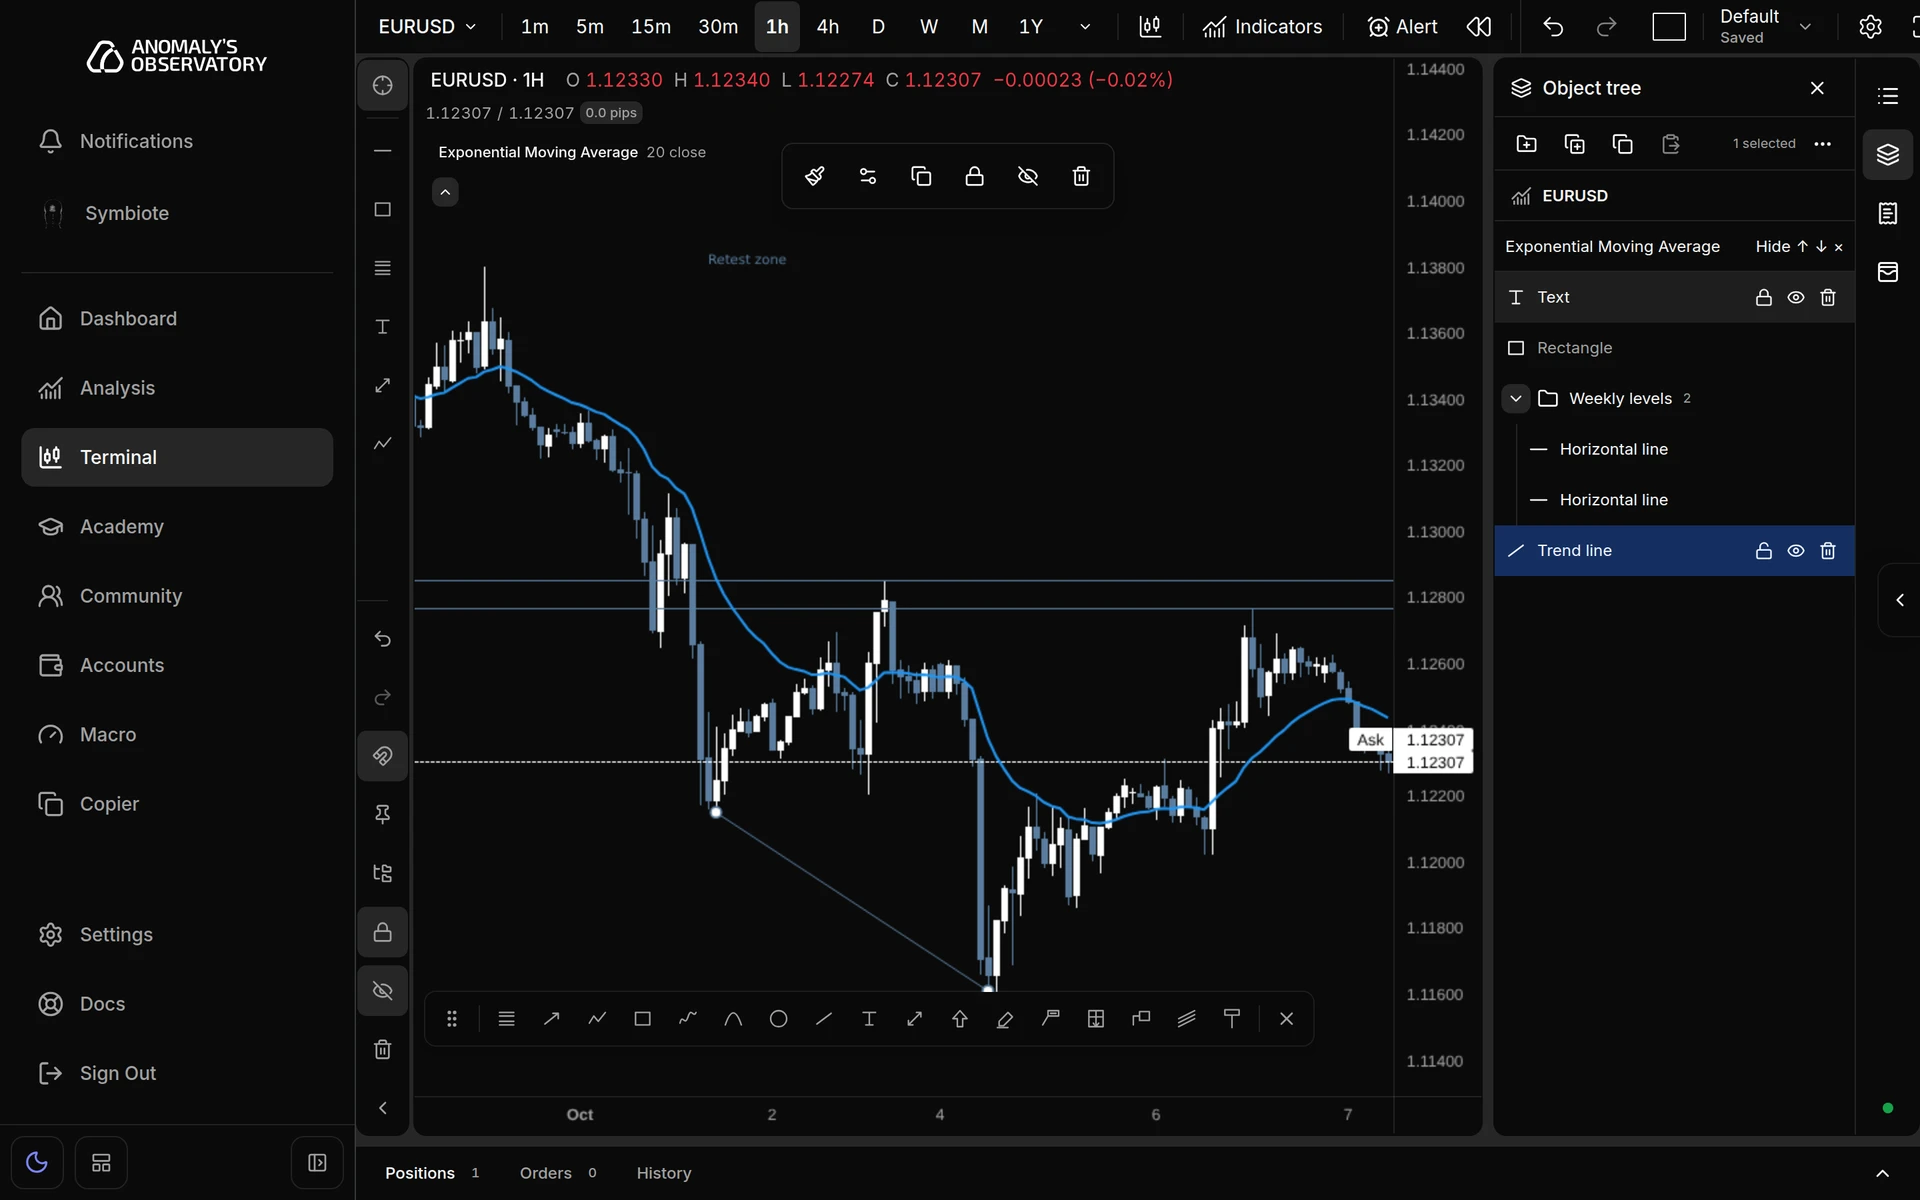
The first row is the symbol. Click it to open Chart settings. Indicators come next. Click an indicator’s name for its settings, or use Hide or Show, the arrows to reorder it, and × to remove it. Drawings follow, with the frontmost at the top.
- Click a drawing to select it on the chart. Shift-click selects a range and Ctrl-click (⌘-click on a Mac) adds or removes one.
- Double-click a drawing to open its settings.
- Hover a row for lock, hide and delete buttons.
- Drag rows to change which drawing sits in front, or drop them onto a group.
- Greyed-out names are hidden, or set not to show on the current interval. Hover a row to see which.
The bar at the top has Create a group of drawings, Clone selection, Copy selection and Paste drawings, then a count and Selection actions.
Right-click a drawing or group for more:
- Settings and Template
- Visual order: Bring to front, Send to back, Bring forward, Send backward, and Move below candles or Move above candles
- Visibility on intervals: Current interval and above, Current interval and below, Current interval only, All intervals
- Create a group of drawings, Move to group and Move out of group to front, or Ungroup on a group
- Clone, Copy, Paste and Rename
- Reverse on a long or short position
- Lock or Unlock, Hide or Show, and Remove
- Go to drawing scrolls the chart to it
Hide, lock and delete
| To | One drawing | Every drawing on the symbol |
|---|---|---|
| Hide | Hide drawing on its toolbar, or the eye in the object tree | Hide all drawings on the drawing toolbar |
| Lock against edits | Lock drawing on its toolbar, or the lock in the object tree | Lock all drawings on the drawing toolbar |
| Delete | Delete, Delete drawing, or the bin in the object tree | Remove all drawings on the drawing toolbar, or right-click the chart and choose Remove all drawings |
Remove all drawings asks you to confirm first, and that can’t be undone. If you delete a single drawing by mistake, press Ctrl Z or click Undo in the chart toolbar.
Keyboard shortcuts
These work while the pointer is over the chart.
| Keys | Tool |
|---|---|
| Shift T | Trend line |
| Shift H | Horizontal line |
| Shift V | Vertical line |
| Shift R | Rectangle |
| Shift F | Fib retracement |
| Shift X | Text |
| Shift M | Price range |
| Shift P | Path |
While drawing, hold Shift to lock trend lines, rays, extended lines, arrows, paths and parallel channels to 45° steps. Hold Ctrl or ⌘ to flip the magnet. With no tool picked, hold Shift and drag to measure. For the rest of the chart shortcuts, see Chart basics.