
Chart basics
Pick a data source, change the symbol and interval, add indicators and set the chart up the way you read it.
The Terminal puts a live chart, your watchlist, the trade ticket and your positions on one screen. This page covers the chart: where its prices come from, how to change what it shows, and the shortcuts that save clicks.
The terminal at a glance
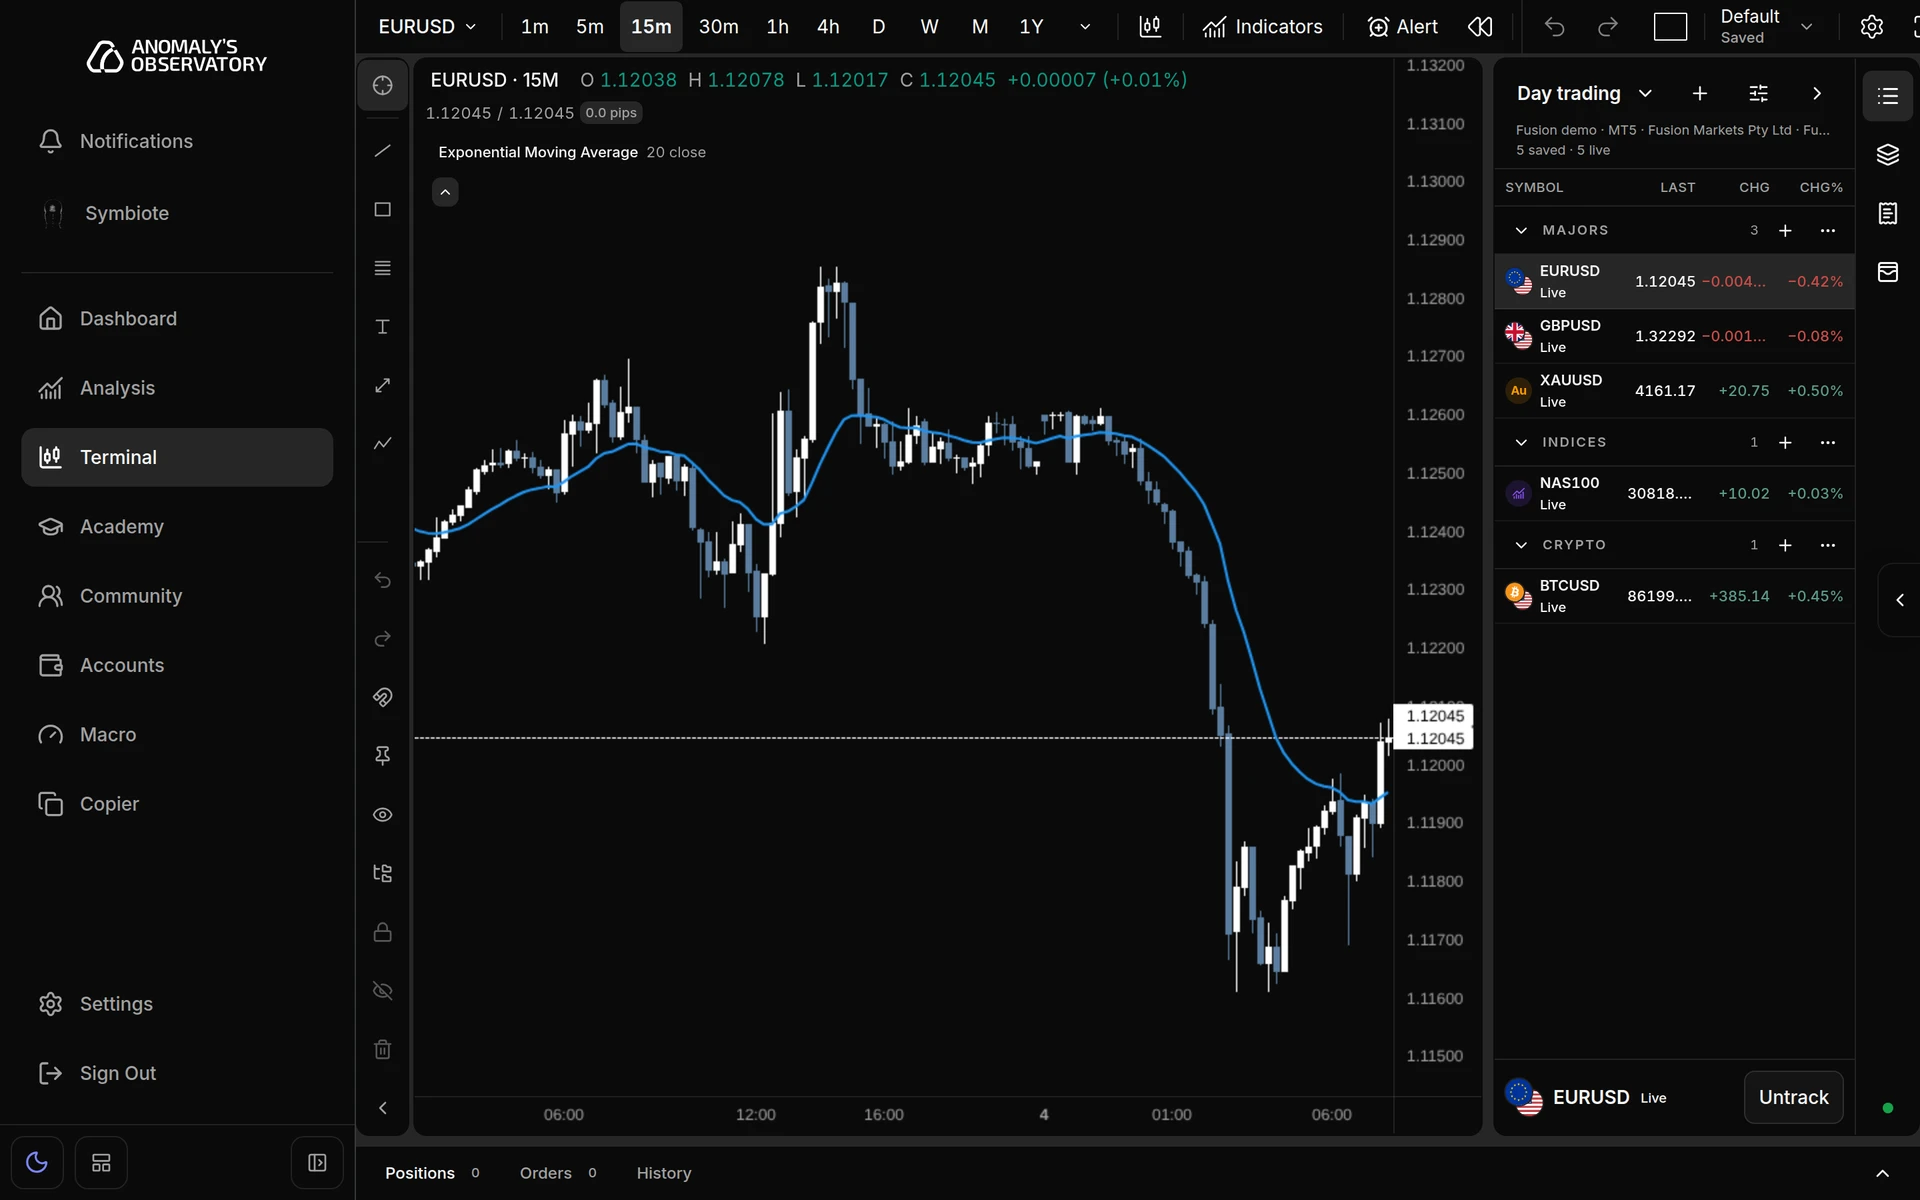
- The chart toolbar runs along the top: symbol, intervals, Chart type, Indicators, Alert, Bar replay, Undo and Redo. On the right are the layout controls, Chart settings and Full screen.
- The drawing toolbar runs down the left edge of the chart. See Drawing tools and the object tree.
- On screens 1,280 px wide and up, the right rail has buttons for Watchlist, Object tree, Trade ticket and Account details, plus Risk controls when the selected account has rules. Click a button to open its panel and click it again to close it. The dot at the bottom of the rail is green while the feed is connected and amber when it isn’t.
- The bottom panel holds Positions, Orders and History for the selected account. It starts collapsed. Click a tab to open it.
Changing the chart from EURUSD to NAS100, switching to 1h and then 30 seconds, and typing 1 5 over the chart to go back to 15 minutes.
Choose a data source
Every chart reads its prices from one source:
- AO Market Data is the app’s own market feed. It’s read-only: you can chart it and add its symbols to your watchlist, but the trade ticket shows Trading is disabled for AO Market Data.
- Each MT4 or MT5 account you’ve connected. The chart uses that account’s prices and symbol names, and the trade ticket sends orders to it.
The terminal opens on your default account. If you haven’t connected one, it opens on AO Market Data. To connect an account, see Connect a trading account.
-
Click Account details in the right rail.
-
Open the Feed & execution menu and pick a source. Accounts are listed with their platform after the name.
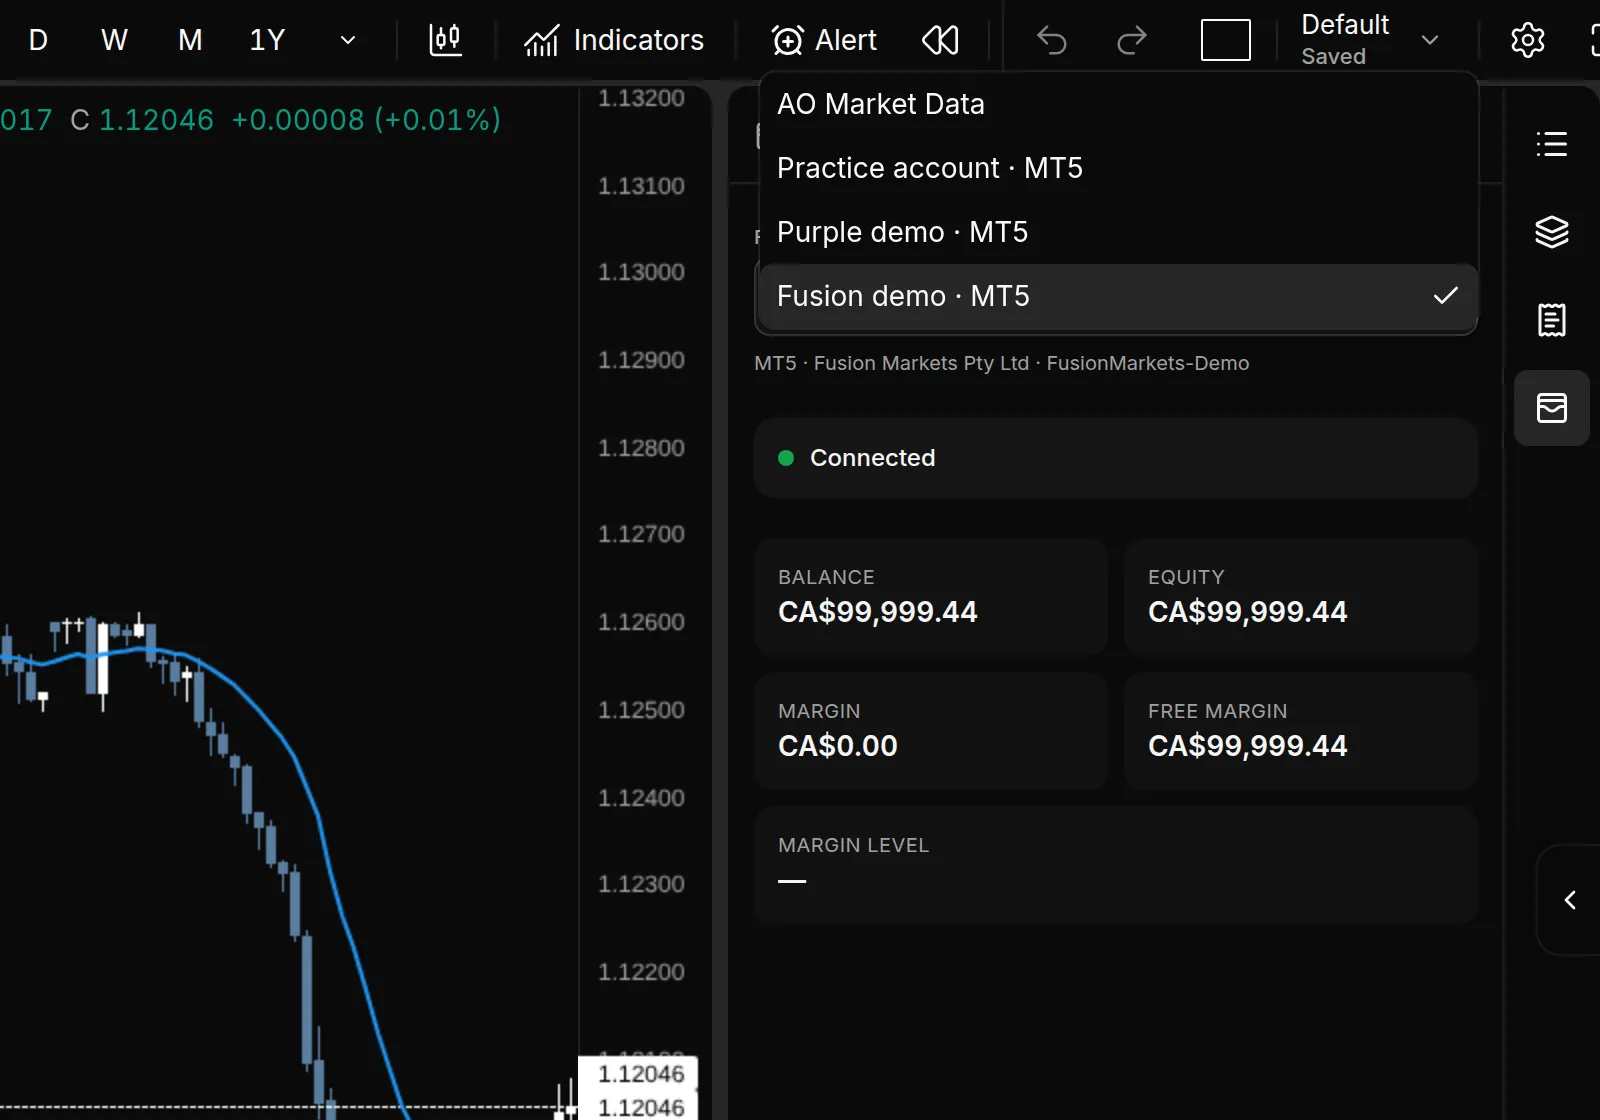
Under the menu you’ll see the platform, broker and server, then the connection status: Connecting…, Synchronizing…, Connected, Reconnecting… or Error. Below that are Balance, Equity, Margin, Free margin and Margin level.
You can also switch sources from the account buttons in symbol search. On a phone, that’s the only place to do it.
Each source keeps its own saved chart layouts, so switching brings back the layout you last used there. See Chart layouts.
Change the symbol
-
Click the symbol name at the left of the chart toolbar. You can also click the symbol in the chart’s top-left status line, or hover the chart and start typing.
-
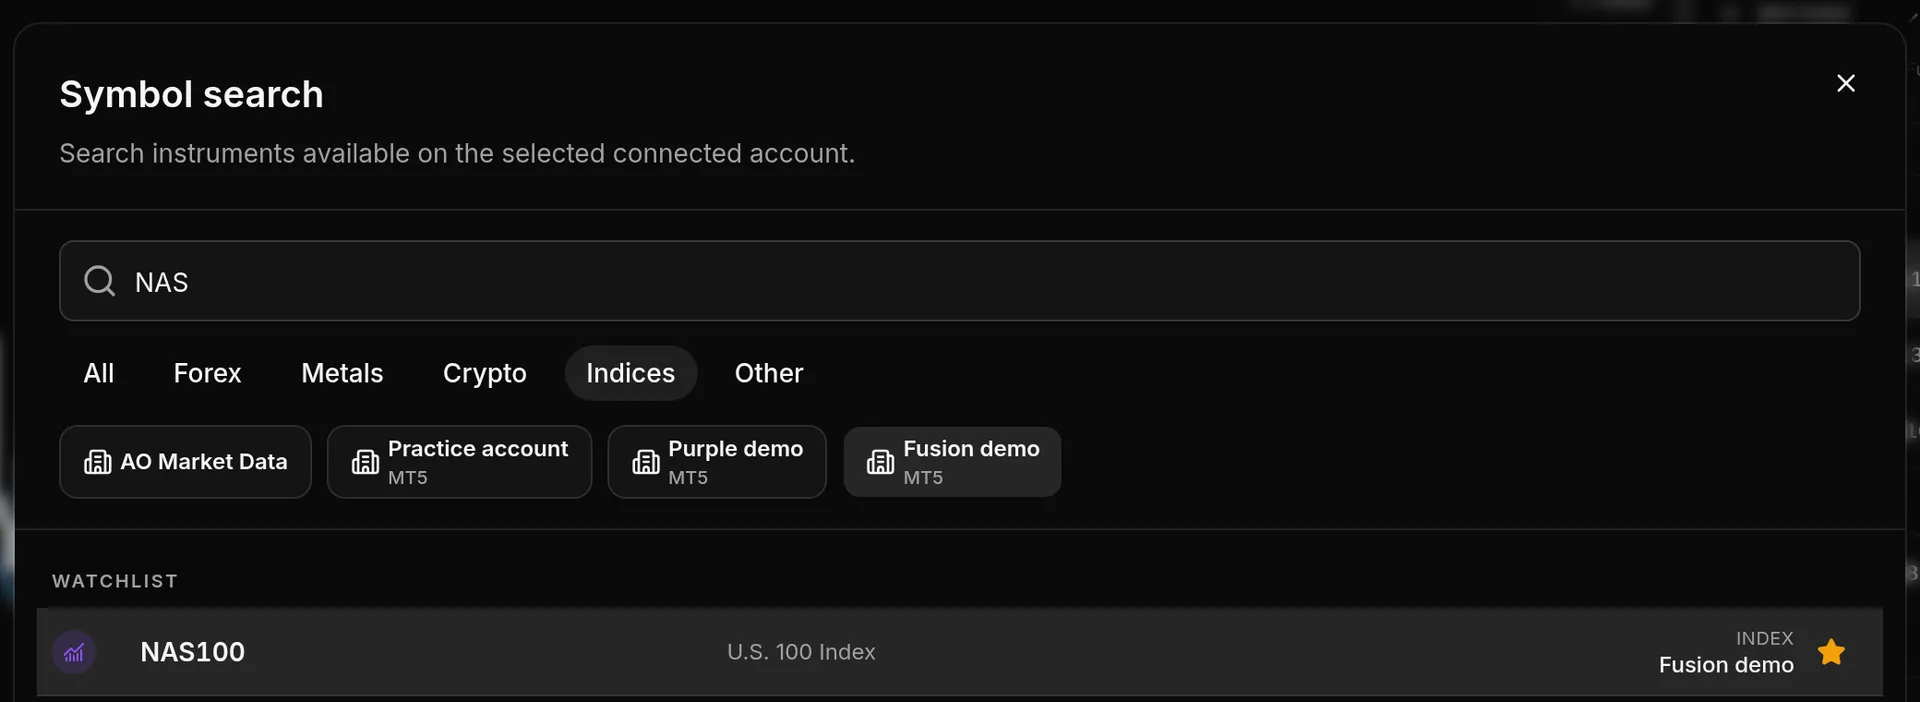
Symbol search opens. Type part of a symbol or an instrument name, or narrow the list with All, Forex, Metals, Crypto, Indices and Other.
-
Click a symbol, or move to it with the arrow keys and press Enter.
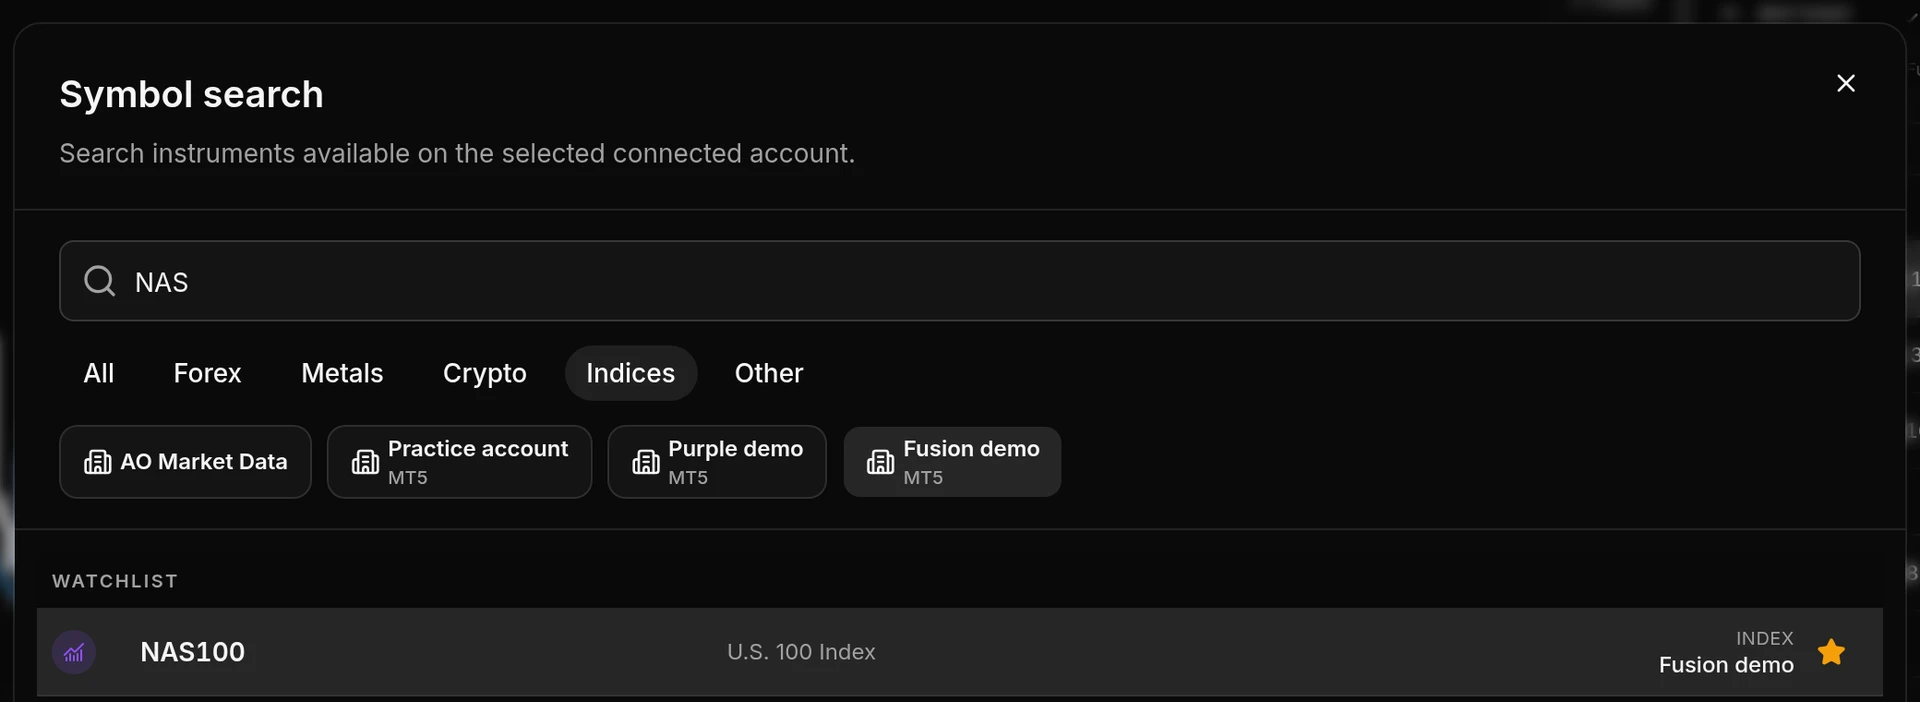
Results come in three groups: Watchlist, Recent (your last eight symbols) and All symbols. Click the star on a row to add that symbol to your watchlist, or remove it, without closing the dialog. The buttons under the tabs are your sources. Picking another one switches the whole terminal to it.
Symbol names come from your broker, so one account may call a market EURUSD and another EURUSD_ecn. If the account doesn’t offer a symbol saved in your layout, the chart switches to the account’s default symbol and a notice tells you which one it’s showing.
Change the interval
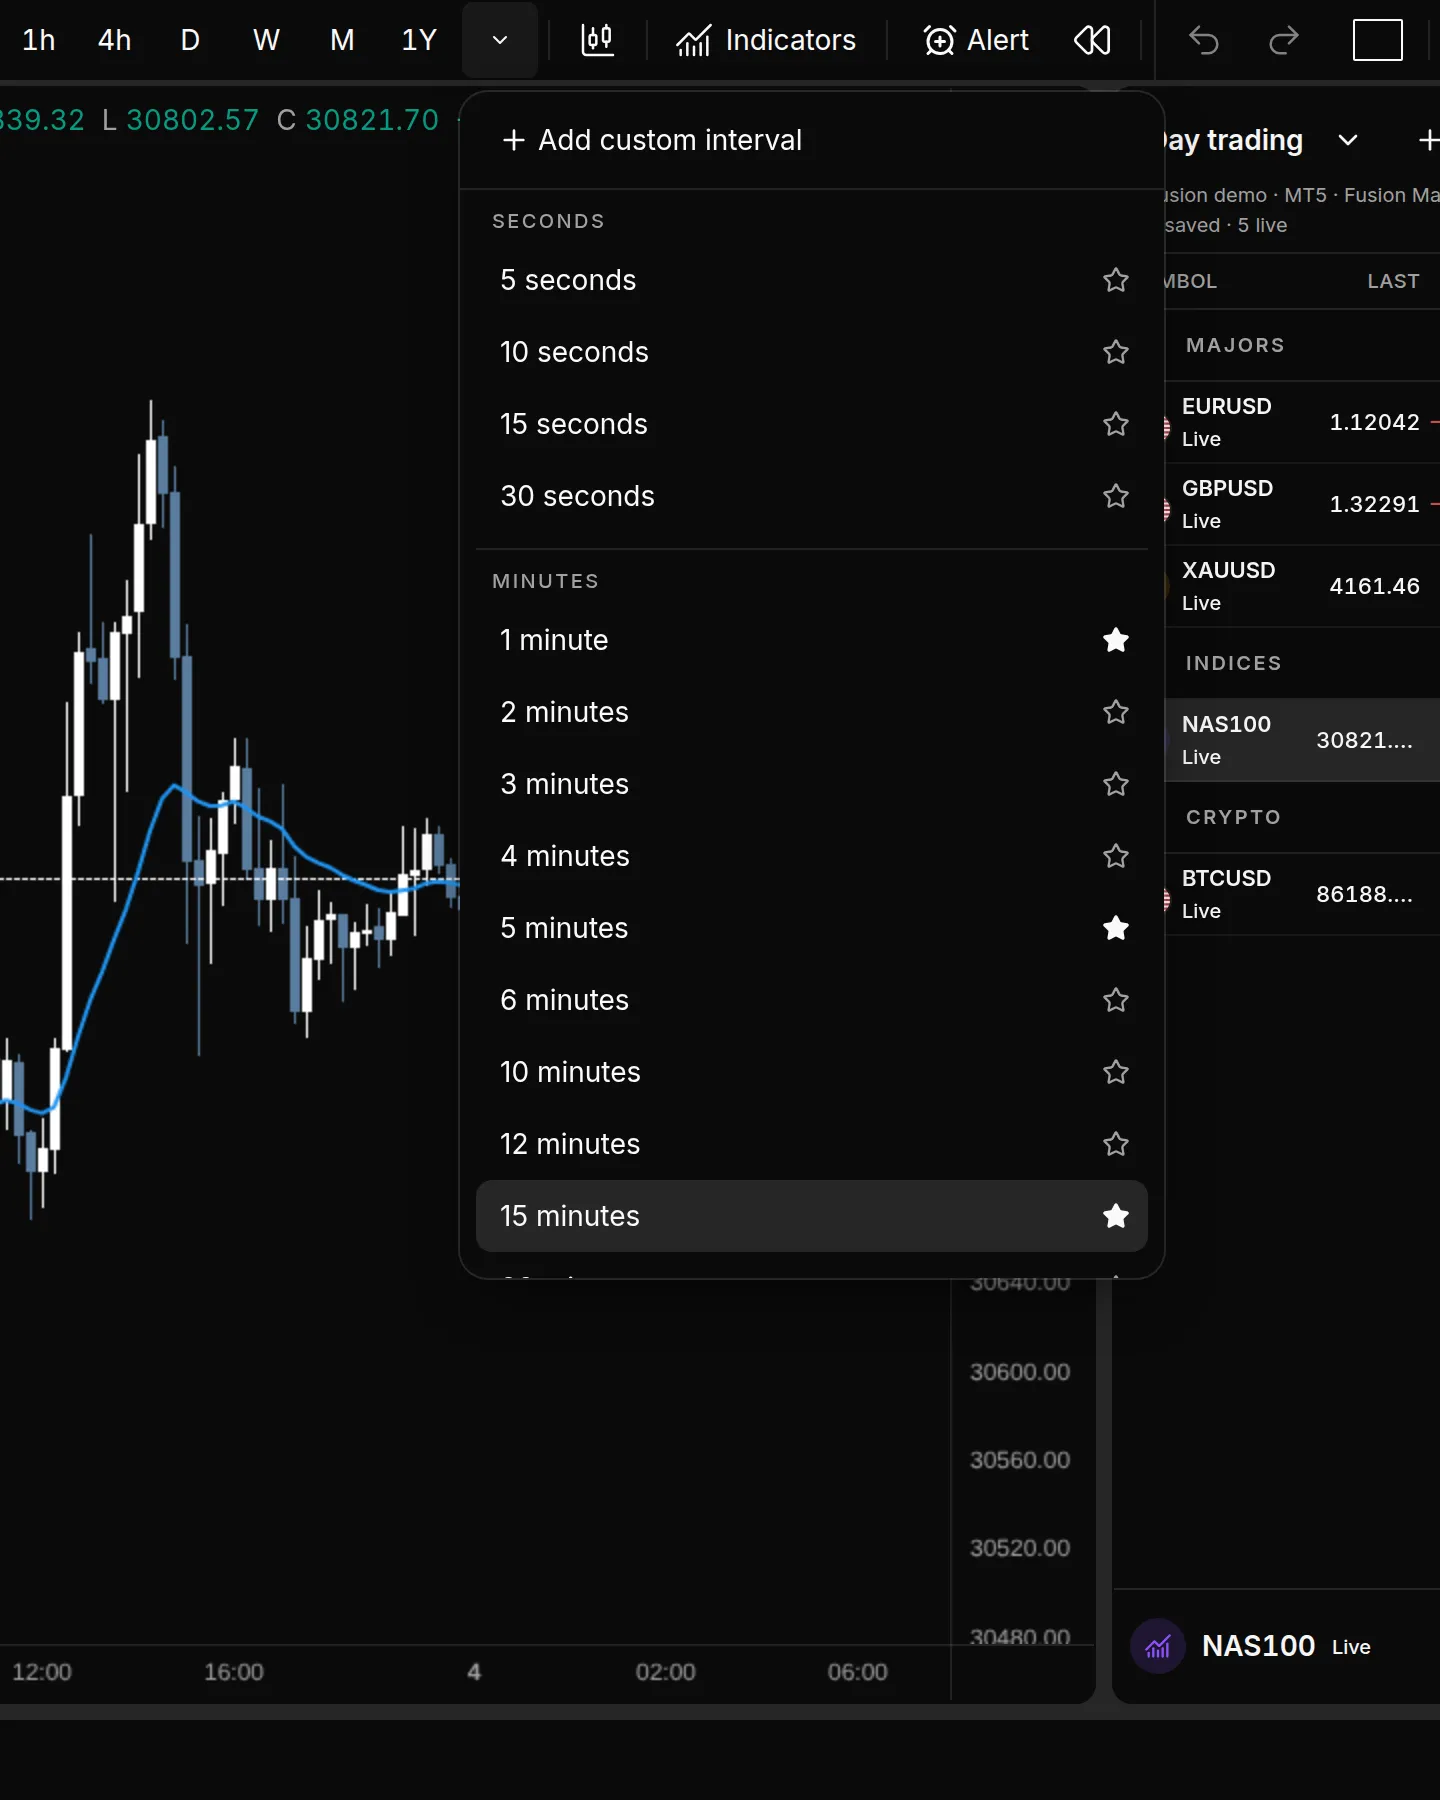
Your favourite intervals sit in the toolbar as one-click chips. You start with 1m, 5m, 15m, 30m, 1h, 4h, D, W, M and 1Y. The button after them opens the interval library. When the current interval isn’t a favourite, that button shows it.
-
Click the interval button with the down arrow. The library groups intervals under Seconds, Minutes, Hours and Days & calendar.
-
Click an interval to switch to it.
-
To pin it to the toolbar, click the star next to it. You can pin up to 12. Click a filled star to unpin.
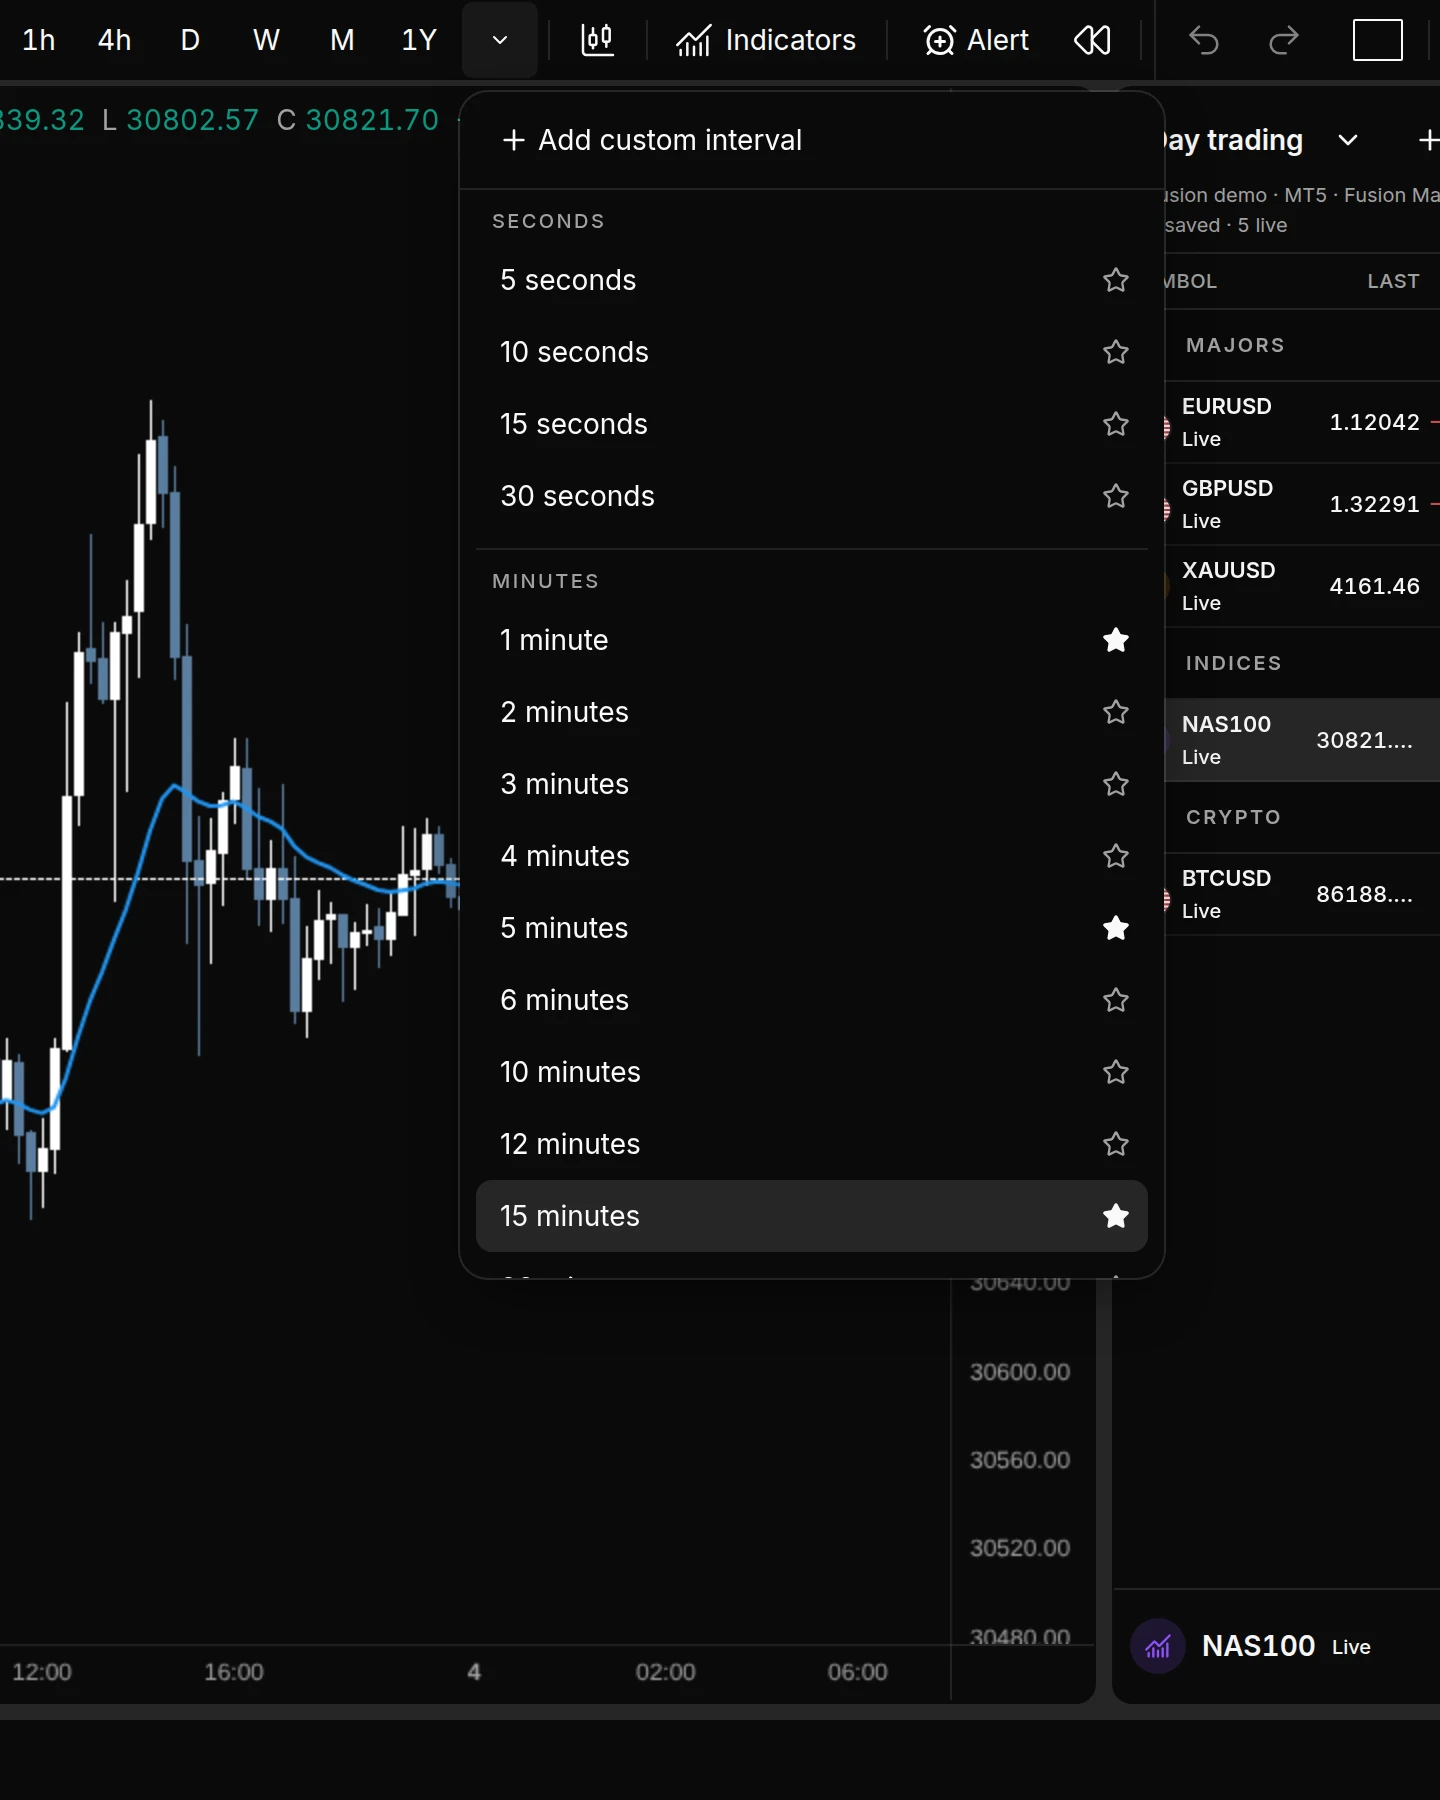
To add an interval that isn’t listed, click Add custom interval, enter an Interval amount, choose an Interval unit and click Add. Custom intervals carry a Custom tag and a bin icon that removes them. You can keep up to 50, up to one year long.
Favourites and custom intervals are saved to your account, so they follow you to other devices. On a phone the chips are hidden and the interval button shows the current interval.
On weekly and longer intervals, such as W, M and 1Y, the last bar is the one still forming. It moves with live prices, so a monthly chart always ends on the current month.
Seconds intervals
5 seconds, 10 seconds, 15 seconds and 30 seconds appear only when the chart is on an MT5 account. You can add 20 seconds as a custom interval. MT4 accounts and AO Market Data start at one minute.
Seconds bars are built from the account’s live ticks. Where AO has recorded history for the symbol, the chart loads it. Otherwise bars start from the moment you open the chart.
Chart type
The chart draws candlesticks. The Chart type menu has one option today, Candles.
Indicators
- Click Indicators in the chart toolbar.
- In Add an indicator, search or click the one you want. It appears on the chart straight away.
| Indicator | What it draws |
|---|---|
| Day of Week | Day boundaries, weekday labels and each day’s high-to-low range. |
| Exponential Moving Average | A moving average weighted toward recent prices. You set the length and the source. |
| Higher Timeframe Candles | Recent candles from higher timeframes, drawn beside live price with a countdown. |
| Session / Expiry Range | Asia range, CBDR, New York midnight open and standard-deviation projections. |
Indicators are listed at the top left of the chart. Hover one to hide it, open its settings or remove it. Its More menu adds Move up and Move down. Settings preview on the chart as you change them. Click Save to keep them or Cancel to drop them.
Indicators stay on the chart when you change symbol or interval. In a multi-chart layout, each chart keeps its own set. To clear them all, right-click the chart and choose Remove all indicators.
Read and move around the chart
- The status line at the top left shows the symbol and interval, then the open, high, low and close of the bar under the cursor, and its change from the previous close.
- Next to it are the live bid and ask and the spread in pips. Prices delayed appears beside the symbol when its prices stop updating.
- Drag the chart to move through time and scroll to zoom. Older bars load as you scroll left.
- Click the price scale once to copy that price.
- Right-click the chart for Reset chart view, Copy price, Object tree, Remove all drawings, Remove all indicators and Settings….
- Hover the chart and a + button follows the cursor’s price at the right edge. Click it to start a buy or sell order at that price. The same choices sit at the top of the right-click menu. See Place a pending order.
Chart settings
Click Chart settings, the gear at the right of the toolbar.
- Candle colors: Default or Monochrome. Under My schemes, New scheme… lets you set your own body, border and wick colours.
- Background grid and Seconds on the time axis.
- Show trade history draws your closed trades on the chart.
- Show active positions draws entry, stop and target lines for open positions and pending orders. The order ticket’s preview lines show either way.
- Ask line adds a price line for the ask, labelled Ask, so the gap between the two price labels is the spread.
- Status line picks what the top-left readout shows: Symbol, Interval, OHLC values, Price change, Percentage change, Bid and ask and Spread.
- Time zone sets where indicators draw day and session boundaries: New York (the default), London, Tokyo, Sydney or UTC.
- Crosshair: Free, Snap to prices or Hidden.
These settings are saved in this browser. Your own colour schemes are saved to your account.
Full screen, at the far right of the toolbar, fills the screen with the terminal. Click Exit full screen or press Esc to leave.
Resize the panels
Drag the gap between two panels to resize them. There’s one between the chart and the right rail, one between the charts and the bottom panel, and one between each pair of charts in a multi-chart layout. Drag the right rail all the way in to close it, and drag it back or click a rail button to reopen it. Sizes are remembered in this browser.
To open or close the bottom panel, click the active tab or the arrow at its right end.
On a phone
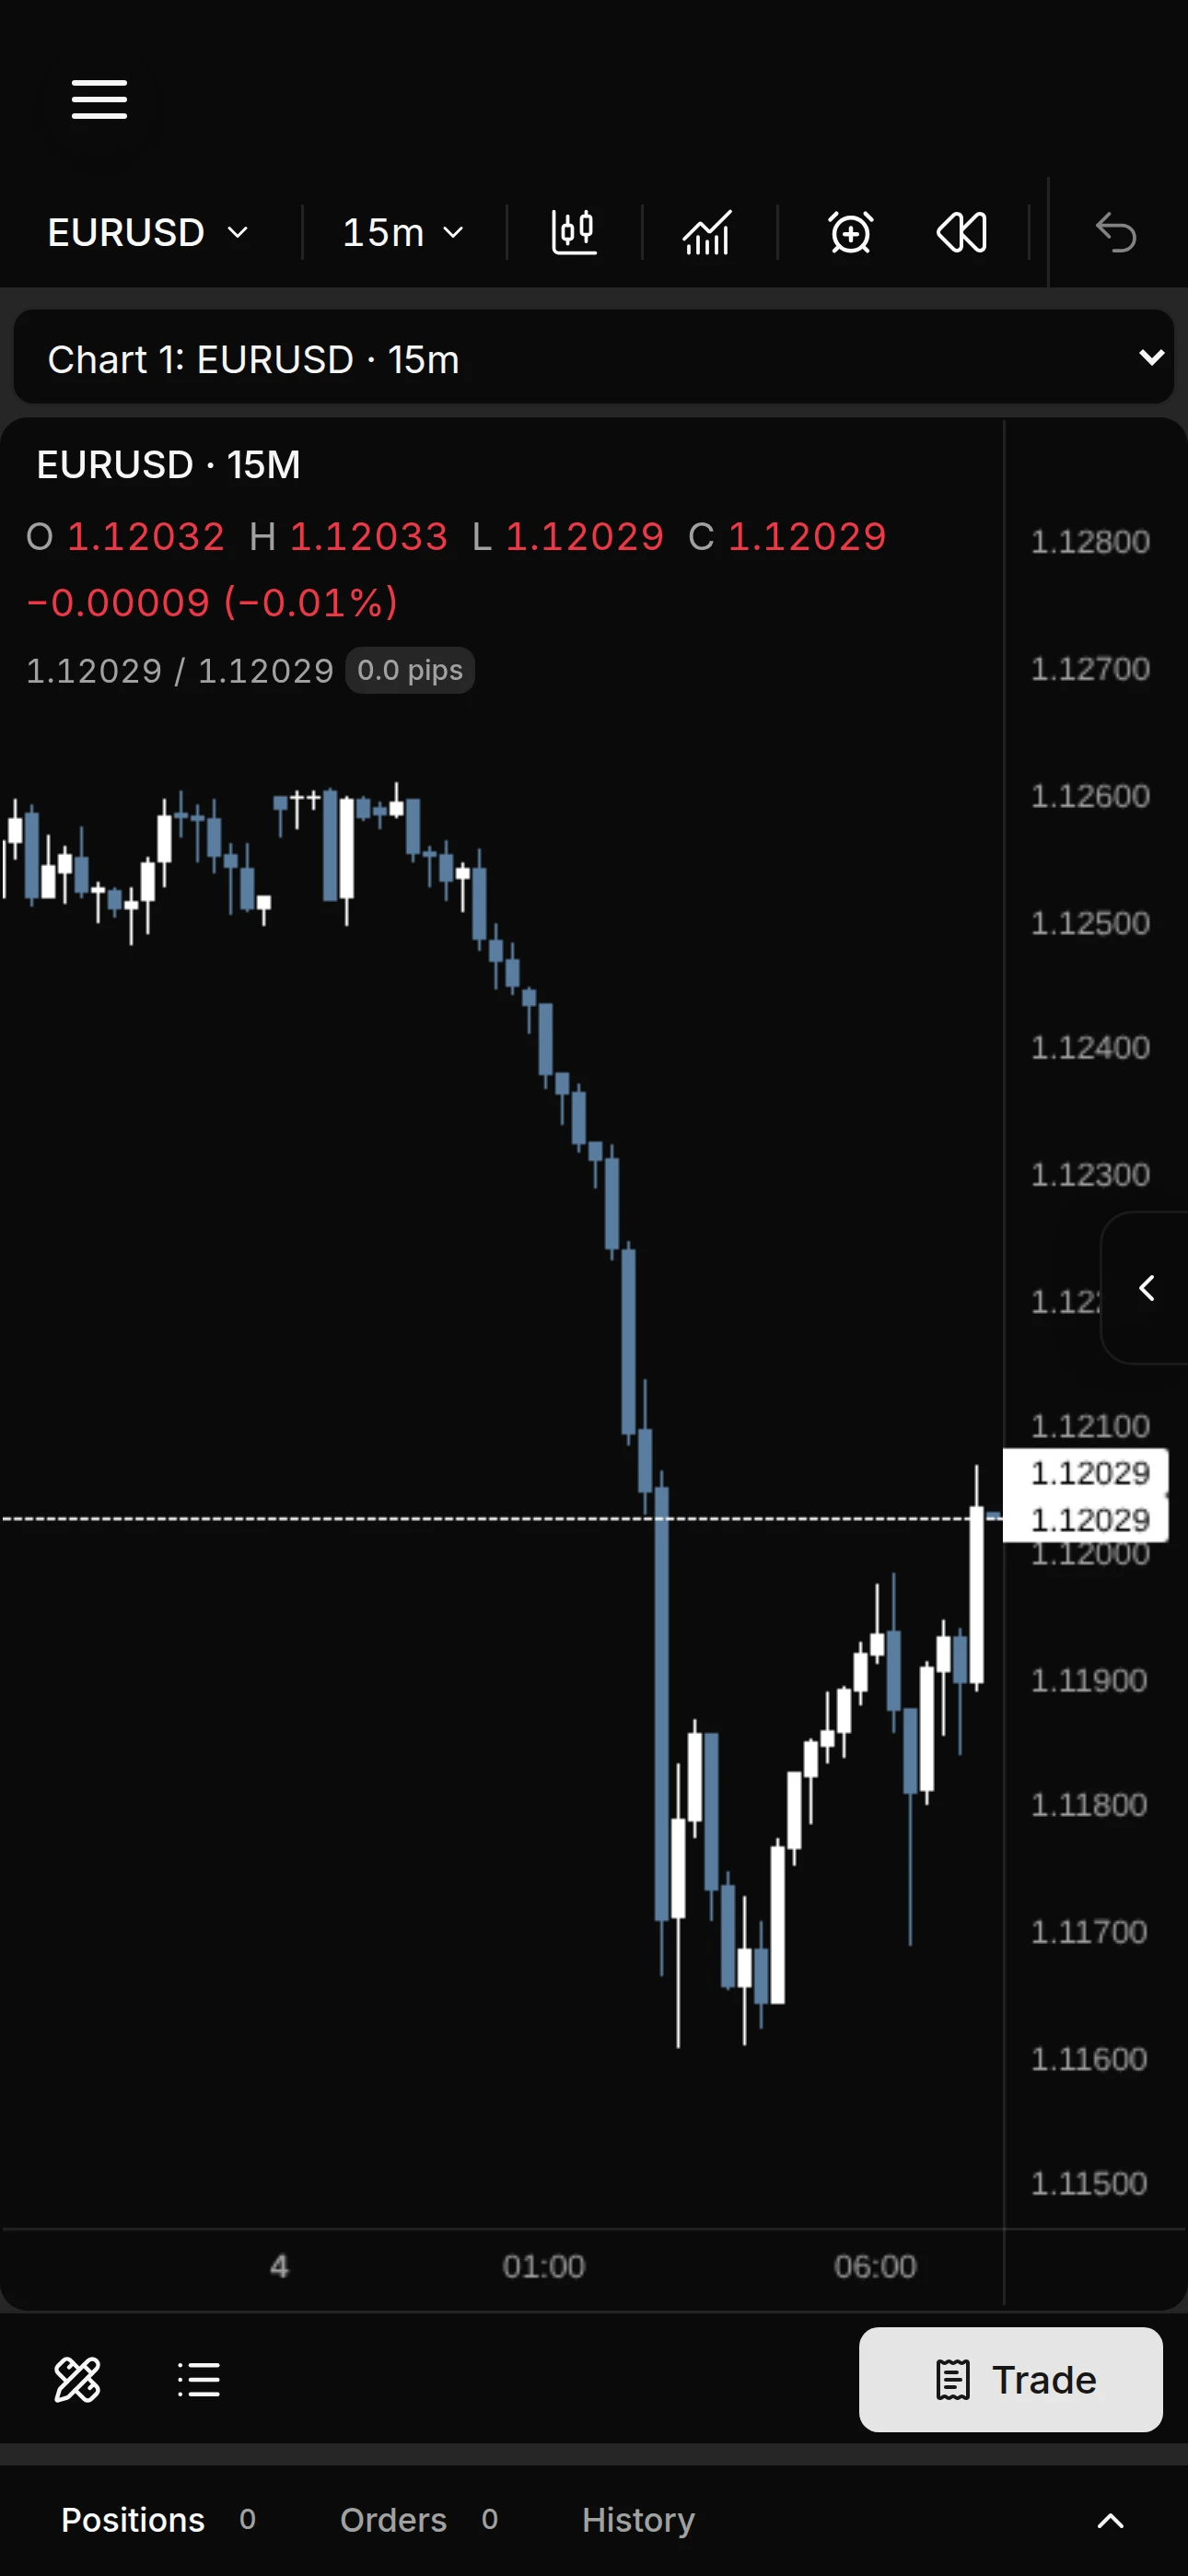
The chart fills the screen width. The bar at the bottom has Show drawing tools (the pencil and ruler), Open watchlist (the list icon) and Trade. Trade opens the order ticket as a sheet over the lower part of the screen while the chart above stays live. The menu above the chart names the chart on screen, for example Chart 1: EURUSD · 15m. If your layout has more than one chart, the phone shows one at a time. Pick another from that menu.
Keyboard shortcuts
Shortcuts work while the pointer is over the chart or the chart has focus. They pause while a dialog is open or while you’re typing in a field.
| Keys | Action |
|---|---|
| Any letter, for example e | Open symbol search with that letter typed in. |
| A number, then a unit letter: 4 h, 1 d, 3 0 s | Switch interval. Units are s seconds, m minutes, h hours, d days, w weeks and y years. |
| A number on its own, for example 1 5 | Switch to that many minutes after a short pause. |
| Ctrl Z (⌘ Z on a Mac) | Undo the last drawing change. |
| Ctrl Shift Z or Ctrl Y | Redo. |
| Shift plus a letter | Pick a drawing tool. See drawing shortcuts. |
| Shift and drag, with no tool picked | Measure price, bars and time without drawing. See Measure without drawing. |
| Esc | Cancel the drawing in progress, or clear the selection. |
| Delete or Backspace | Remove the selected drawing. |
| Arrow keys | Nudge the selected drawing one bar sideways or one price step up or down. |
Type interval letters without Shift. Shift with a letter is kept for drawing tools.