
Chart layouts
Put up to 16 charts on screen, link their symbol, interval, crosshair and time, and save the arrangement as a named layout.
A chart layout is a saved arrangement of one or more charts: how many, how they’re split, what each one shows, and which settings they share. You can keep several layouts and switch between them from the toolbar.
Creating a layout, splitting it into two charts side by side, and turning on crosshair and time sync.
Where layouts live
The layout controls sit at the right of the chart toolbar:
- Layout setup, the grid icon, sets the number of charts and what they share.
- The current layout’s name, with its save status underneath.
- Manage chart layouts, the arrow beside the name, lists your layouts and the actions for them.
Each data source has its own layouts, so your AO Market Data layouts are separate from the ones on each broker account. The first time you open a source, the terminal makes a one-chart layout called Default. You can keep up to 20 layouts per source.
Create a layout with two charts
-
Click Manage chart layouts and choose New layout.
-
Type a name and click Save name. The new layout opens with one chart on the symbol and interval you last picked on this data source.
-
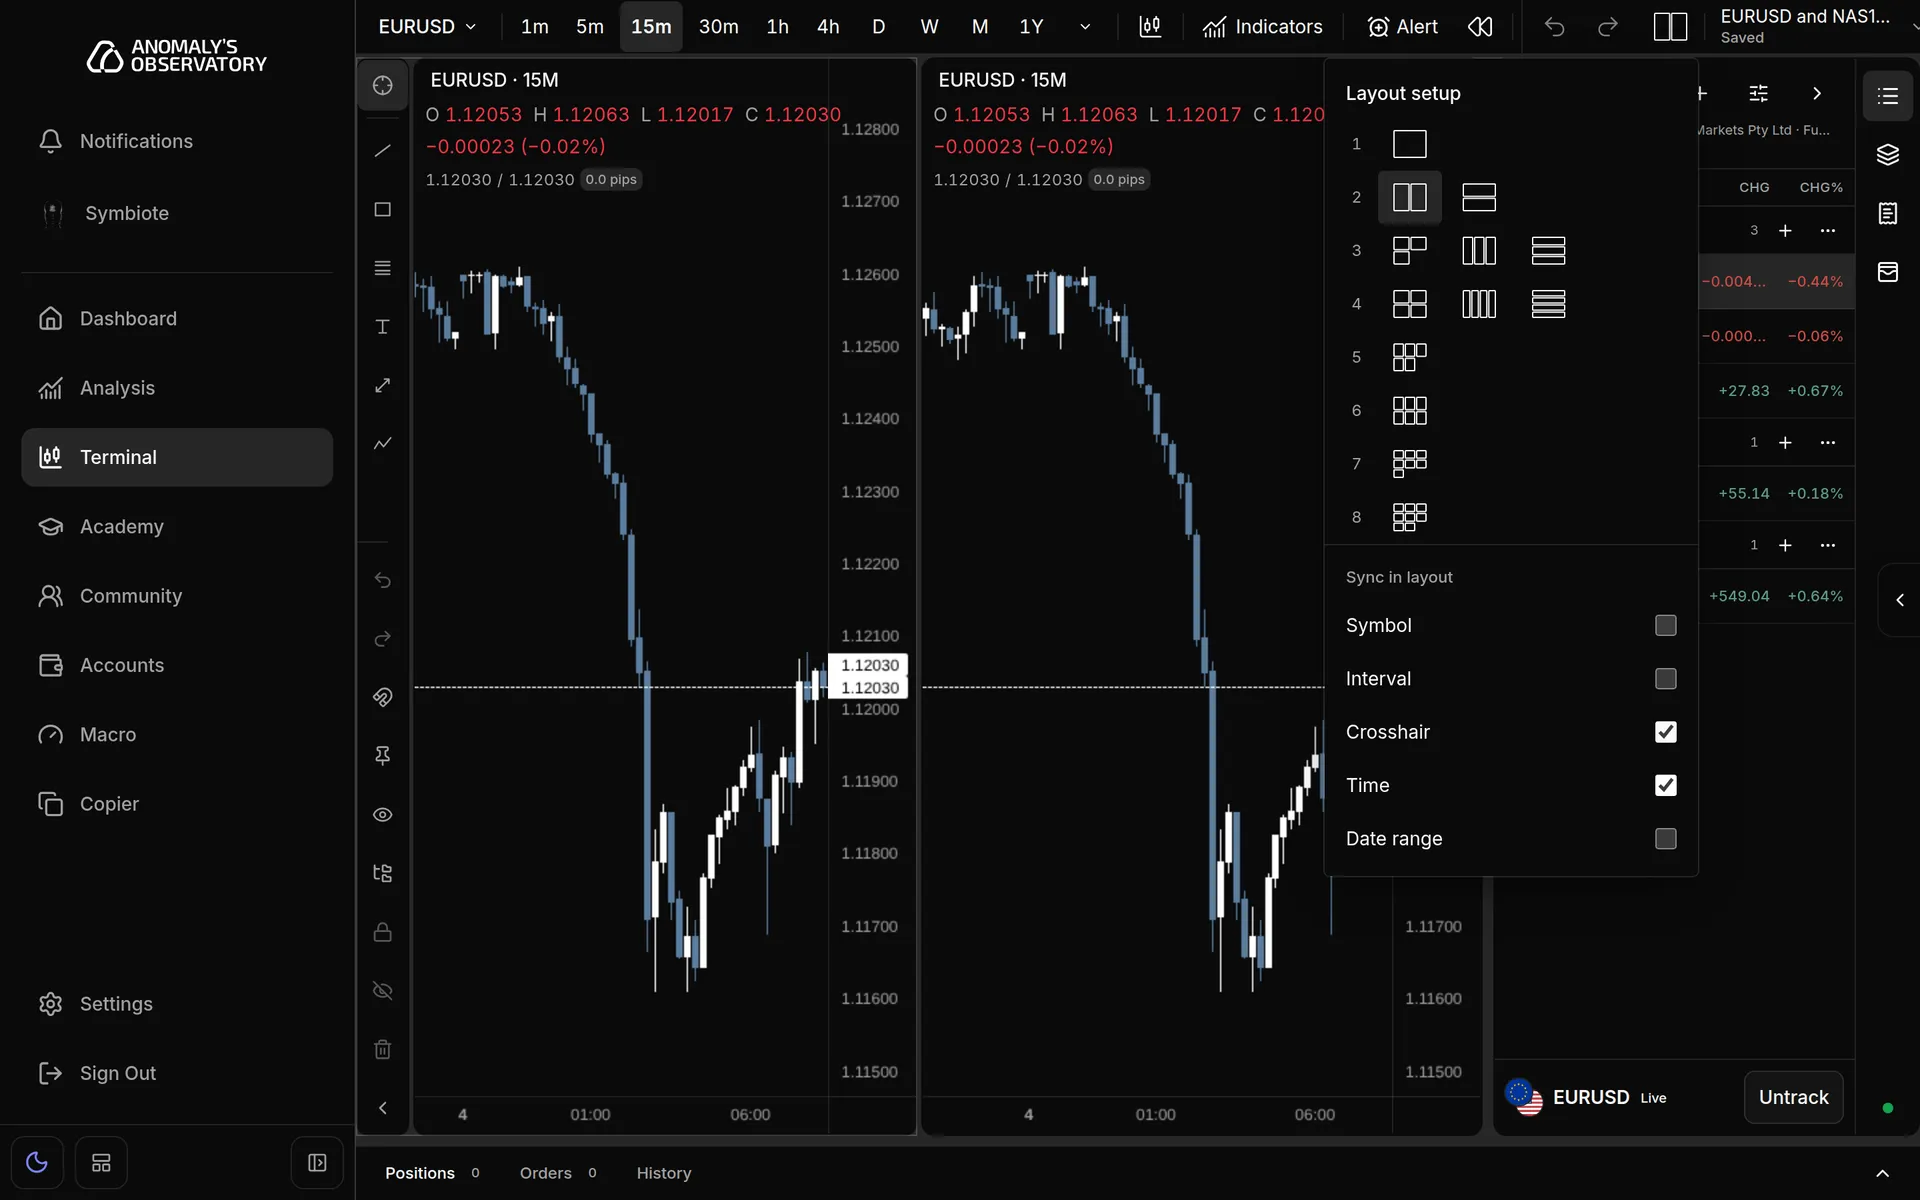
Click Layout setup. In the row marked 2, choose side by side or stacked.
-
Under Sync in layout, tick what the charts should share. See Sync charts.
-
Click the second chart to make it active, then change its symbol or interval.
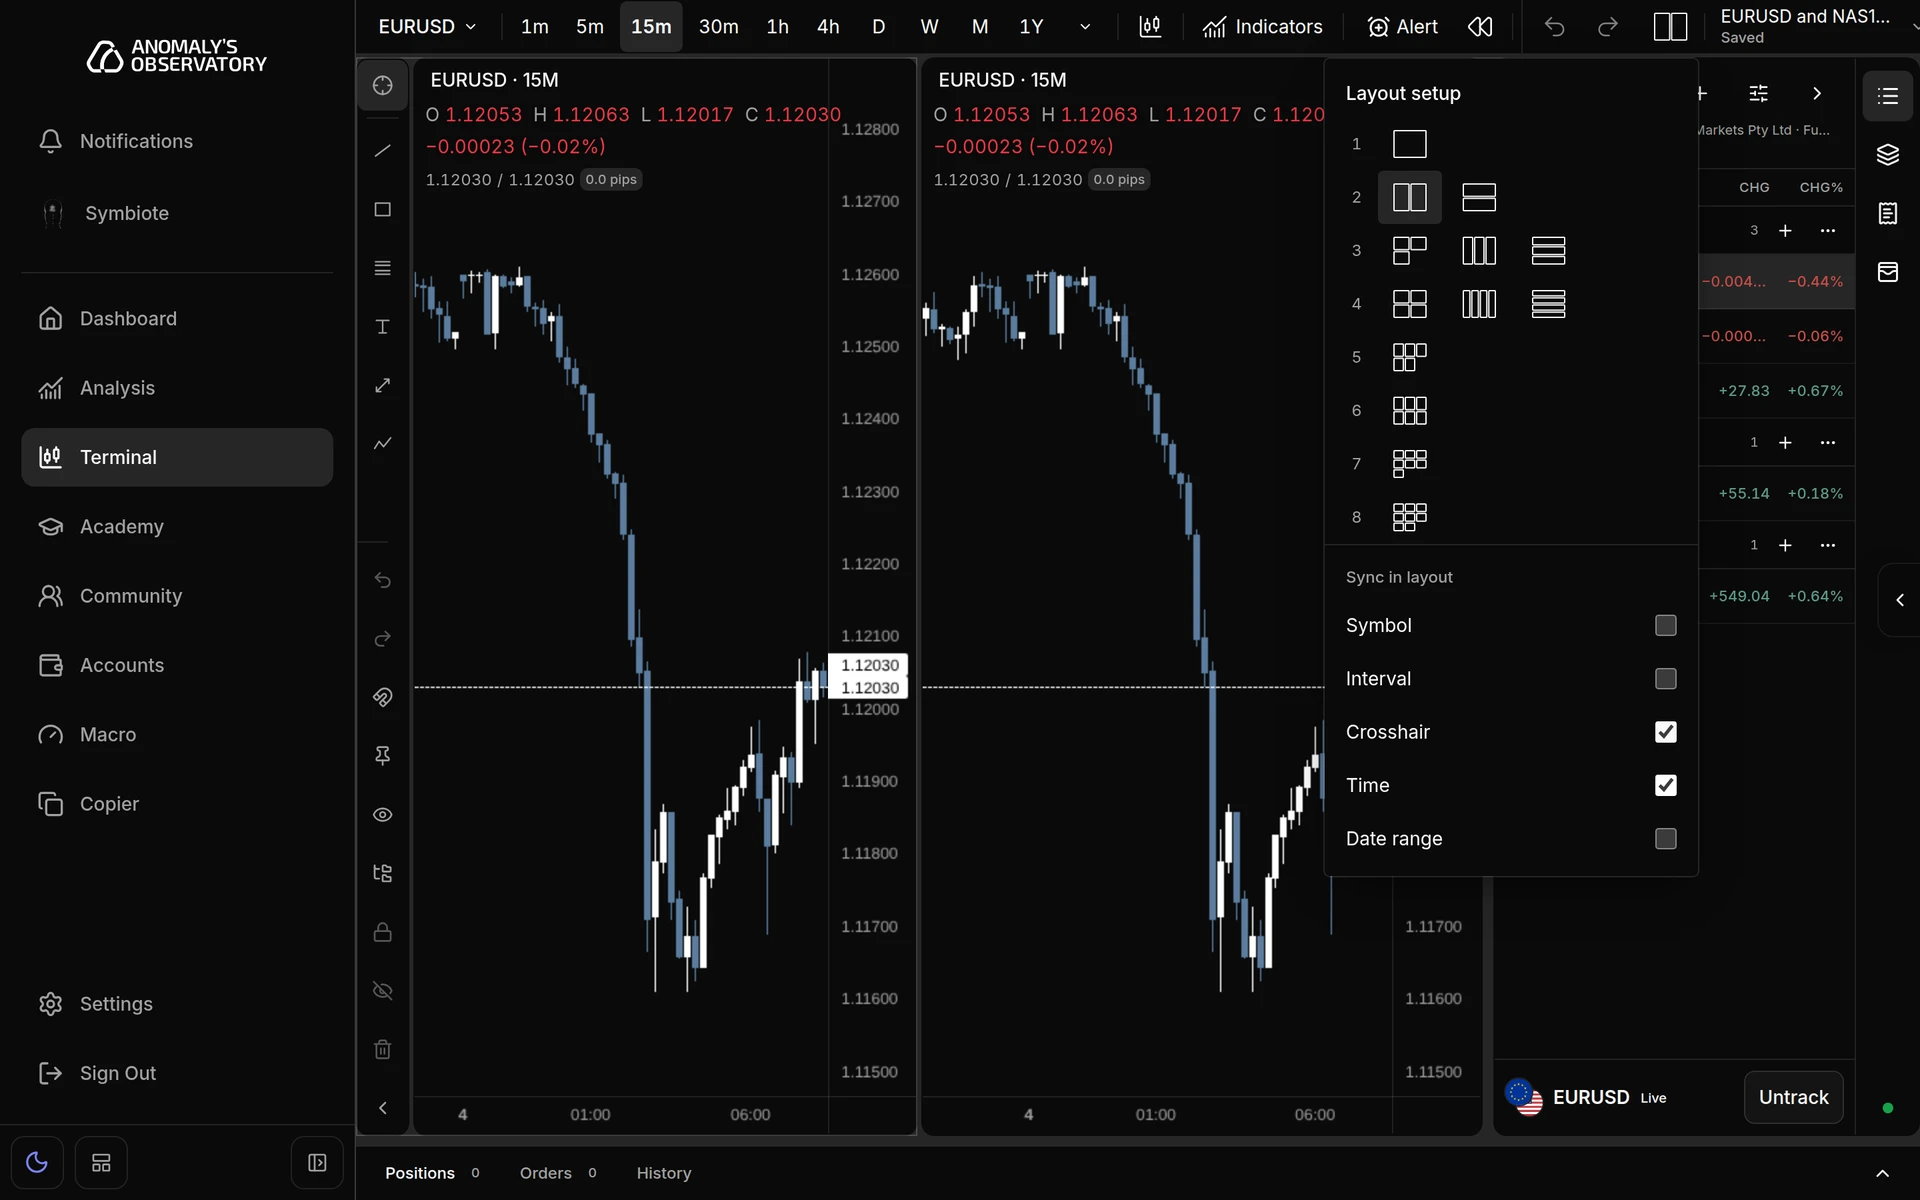
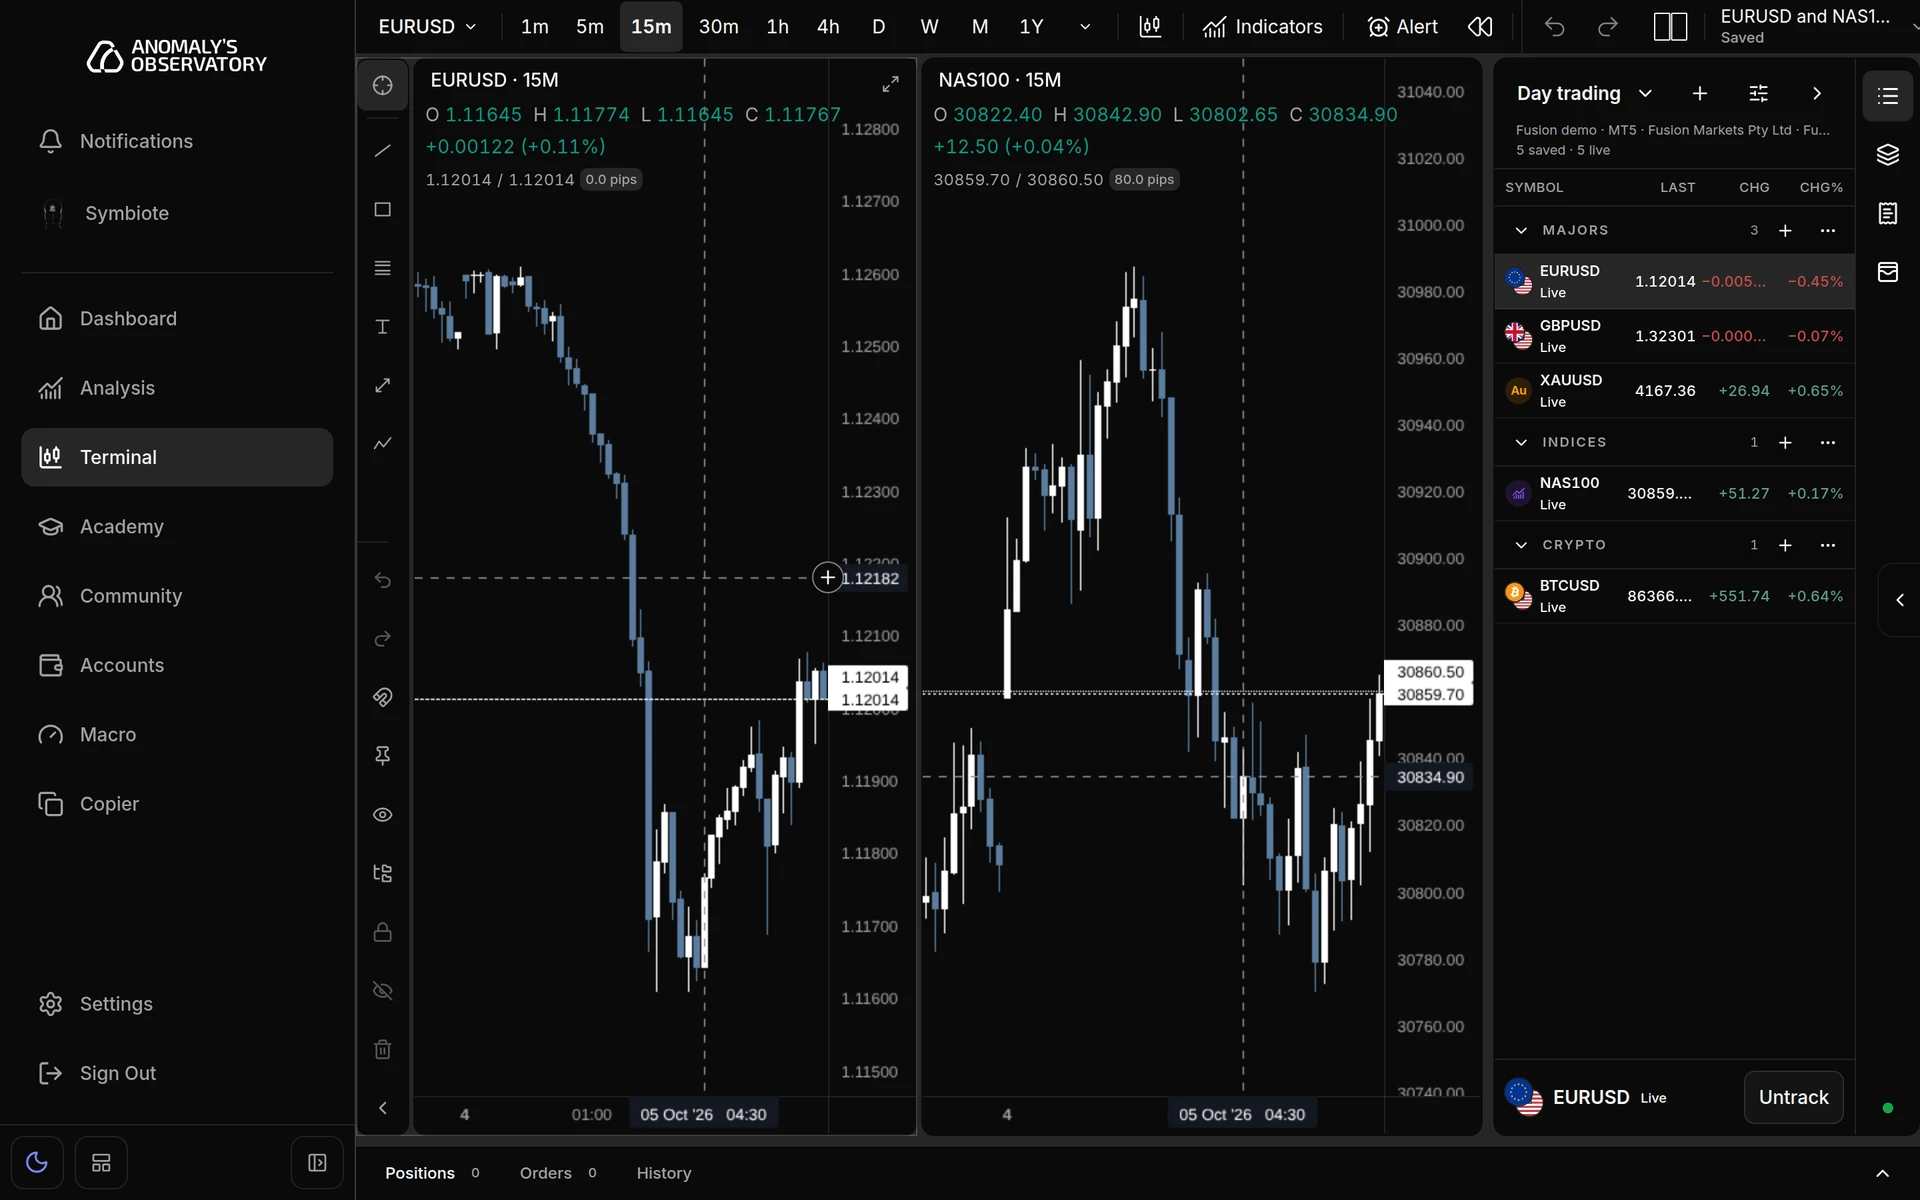
New charts start with the active chart’s symbol and interval. Layouts save themselves a moment after each change: the label under the name reads Saving…, then Saved.
Arrangements
Layout setup offers 1 to 10, 12, 14 or 16 charts.
- Two charts can sit side by side or stacked.
- Three or four charts can be a grid, side by side, or stacked.
- Five or more charts use a grid.
Drag the gap between charts to resize them. You can also focus a gap with Tab and use the arrow keys. Choosing a different arrangement resets the charts to equal sizes.
To look at one chart on its own, hover it and click the expand icon in its top right corner (Maximize chart 1, Maximize chart 2 and so on). Click it again (Restore chart) to go back to the grid.
Work with several charts
Click a chart to make it active. The active chart has a thin outline. The chart toolbar, the order ticket, the drawing toolbar and the object tree all follow the active chart.
Each chart keeps its own indicators. Drawings belong to the symbol, so a level drawn on EURUSD appears on every EURUSD chart in the layout.
On a phone, only one chart shows at a time. Switch between them with the Active chart menu above the chart.
Sync charts
Tick any of these under Sync in layout. They’re saved with the layout.
| Option | What it does |
|---|---|
| Symbol | Every chart shows the same symbol. Changing it on one chart changes it on all of them. |
| Interval | Every chart uses the same interval. |
| Crosshair | Moving the cursor over the active chart shows a crosshair at the same time on the others. Charts on a different symbol mark their own price at that time. |
| Time | The other charts scroll so their latest visible bar lines up with the active chart’s. Each keeps its own zoom. |
| Date range | The other charts show exactly the same start and end time as the active chart. |
Turning on Symbol or Interval copies the active chart’s setting to every chart straight away.
Manage saved layouts
Click Manage chart layouts.
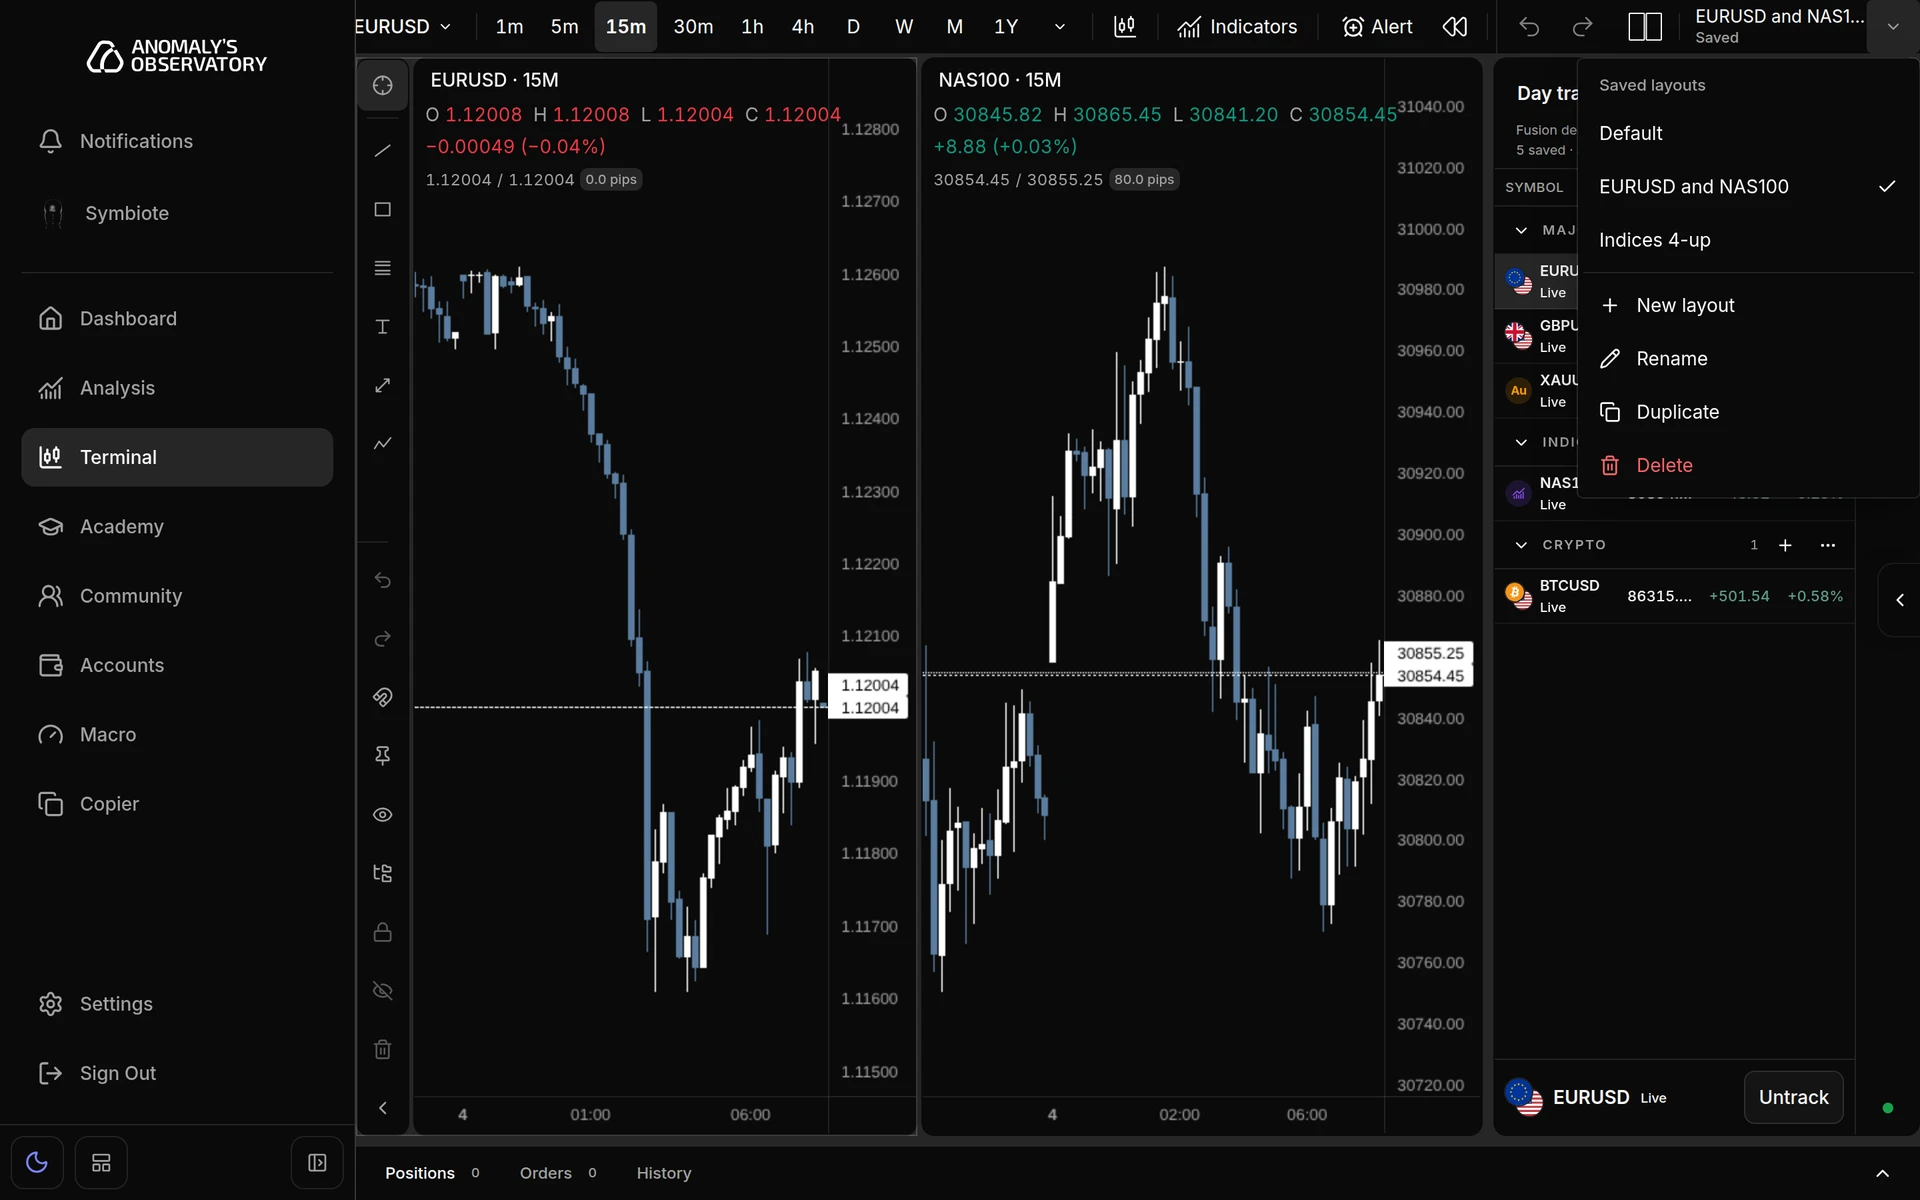
- Under Saved layouts, click a layout to open it. The current one has a tick.
- New layout starts a fresh one-chart layout.
- Rename changes the current layout’s name.
- Duplicate copies the current layout under a new name.
- Delete removes the current layout after you confirm. Your other layouts and your drawings aren’t affected.
- Discard changes appears when the layout has unsaved edits, and goes back to the last saved version.
Any pending changes save before you open another layout or switch to another data source.
If the same layout is changed or deleted in another browser tab, a warning icon (Layout needs attention) appears next to the name. Your changes are kept in this tab. Click Reload saved layout in the warning to load the saved version.
Replay several charts at once
Bar replay can run on just the active chart or on every chart in the layout together. See Replay and paper trading.