
Analysis V2 (alpha)
Switch Analysis to V2 to see your account's return net of deposits and withdrawals, deeper risk measures, a performance score and a monthly statement you can download as a PDF.
Analysis V2 is an early version of Analysis that adds account performance to the trade review in Analysis. V1 measures your closed trades. V2 also measures the account itself: its return net of deposits and withdrawals, how far it fell from its peaks, and how steady its returns have been. It’s in alpha, so expect its layout and numbers to change as it develops.
Switch to V2
Next to the Analysis heading, choose Analysis V2 (marked Alpha). Choose Analysis V1 to go back at any time. Nothing you’ve reviewed or tagged changes when you switch.
- Your choice is saved on this device, so Analysis opens on the version you last used.
- The version is part of the page address, so a link you copy opens the same version.
- V2 adds a How we calculate link at the top of the page. See How we calculate.
The section tabs, date range, account picker, colour profile and Ask work the same as in V1. The Trades tab is the same in both versions.
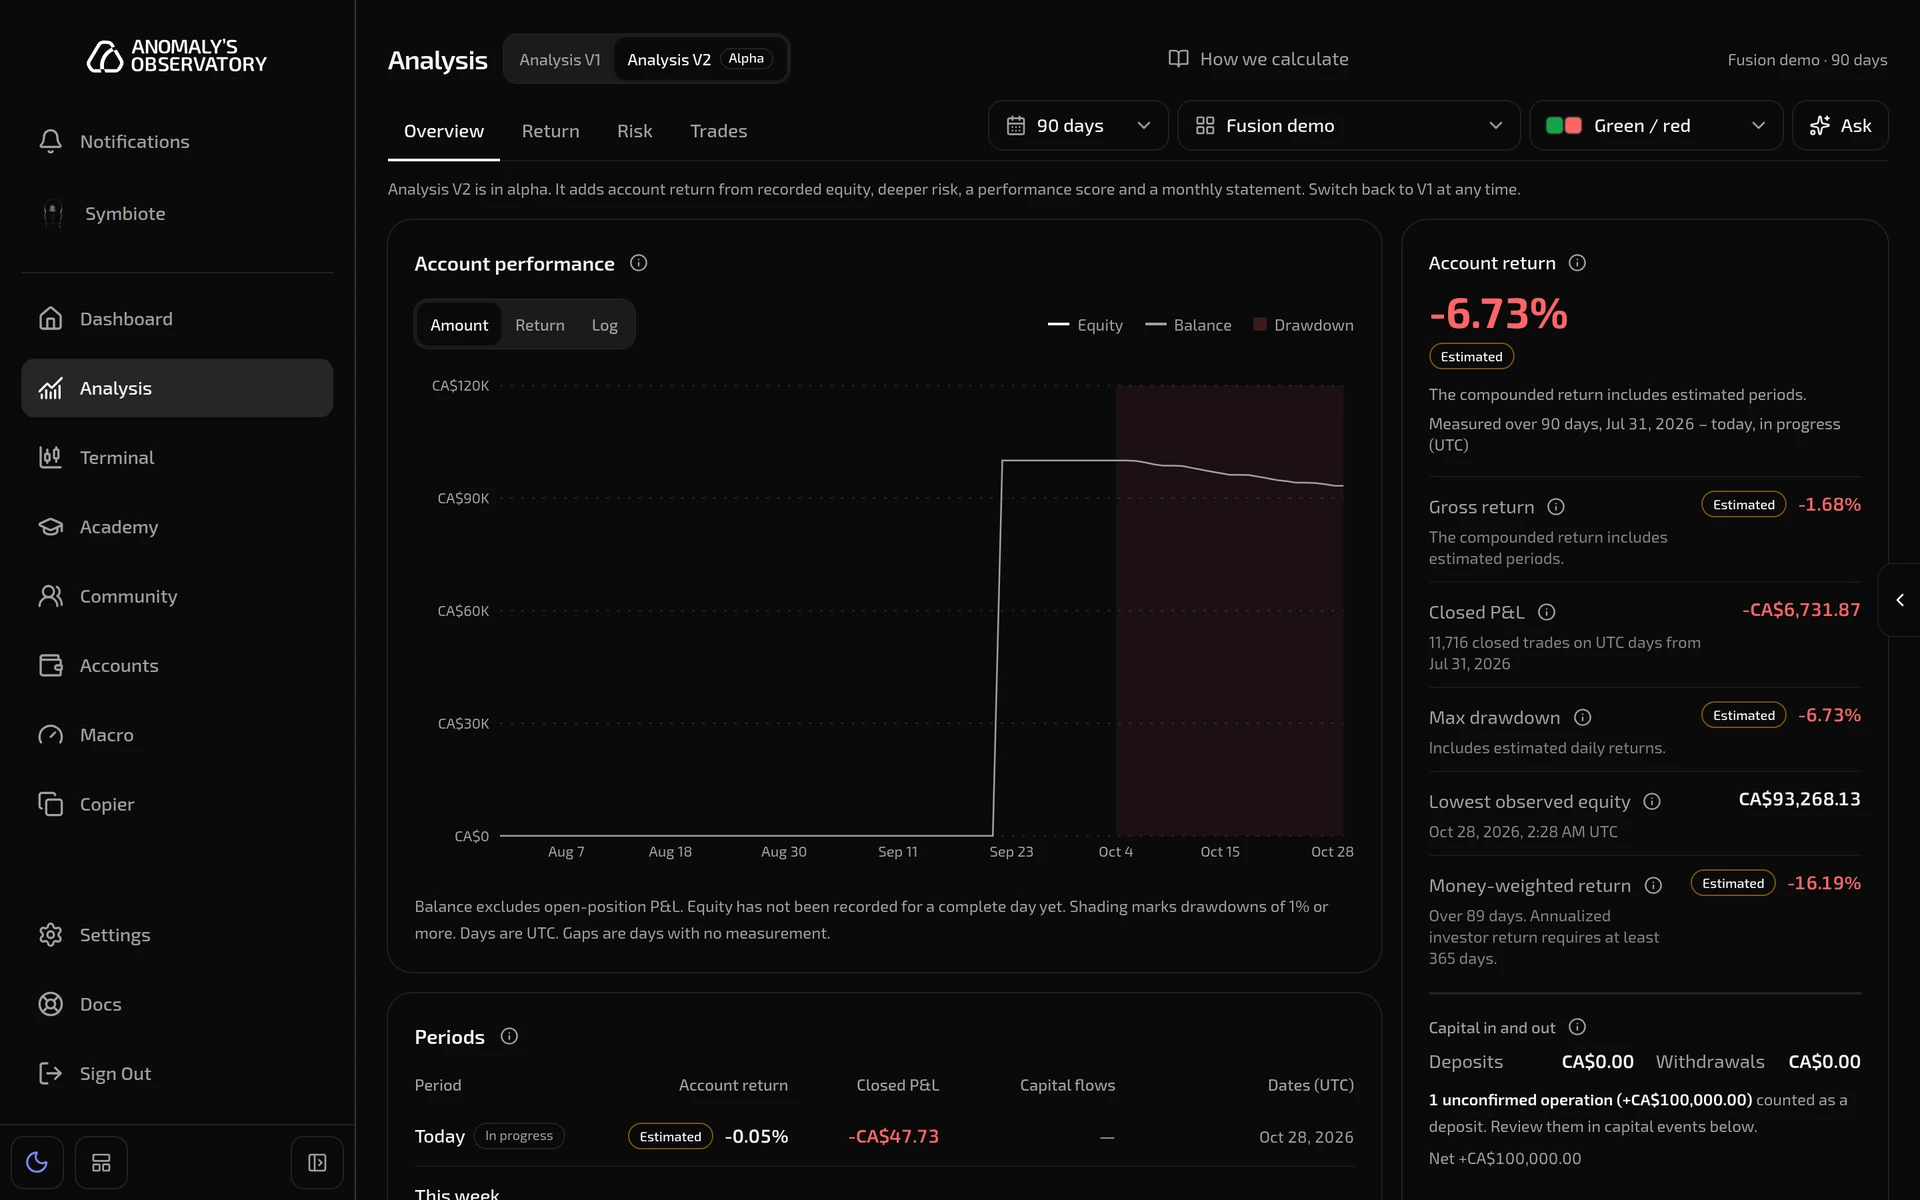
Switching to V2, showing the chart as a return, then the periods, capital events, monthly statement, worst drawdowns and How we calculate.
Estimated returns
V2 works out the account’s return one UTC day at a time from its equity and balance, kept apart from your closed trades. A day measured on balance rather than on recorded equity is an estimate. Balance leaves out open-position P&L, so a figure built from it is marked Estimated, and so is any figure that includes such a day. The Sample line under Account return shows how many days were measured on equity, how many on balance and how many are missing.
Recorded equity isn’t available yet, so for now every return in V2 is marked Estimated. The figures that need recorded equity, such as the performance score and the Monte Carlo simulation, say how much more they need instead of showing a number.
Overview
Account performance charts the account over the range. Switch between Amount, Return and Log:
- Amount draws equity and balance in your account currency.
- Return draws the account’s compounded return, net of deposits and withdrawals. A deposit doesn’t count as profit, and a withdrawal doesn’t count as a loss.
- Log shows the same return on a log scale.
Shading marks drawdowns of 1% or more. Days with no measurement are left as gaps. Point to the chart to see a day’s equity, balance and return.
Beside the chart, Account return gives the compounded return for the range, with:
- Gross return: the return before recorded costs such as commission and swap.
- Closed P&L: the net result of trades closed in the range. It’s money, not a return.
- Max drawdown: the deepest fall from a peak, as a percentage.
- Lowest observed equity: the lowest equity seen, and when.
- Money-weighted return: your return as an investor, weighted by when money went in and out. It’s shown as a yearly rate only after a year of history.
- Capital in and out: deposits and withdrawals in the range, with any balance operations still waiting for your confirmation.
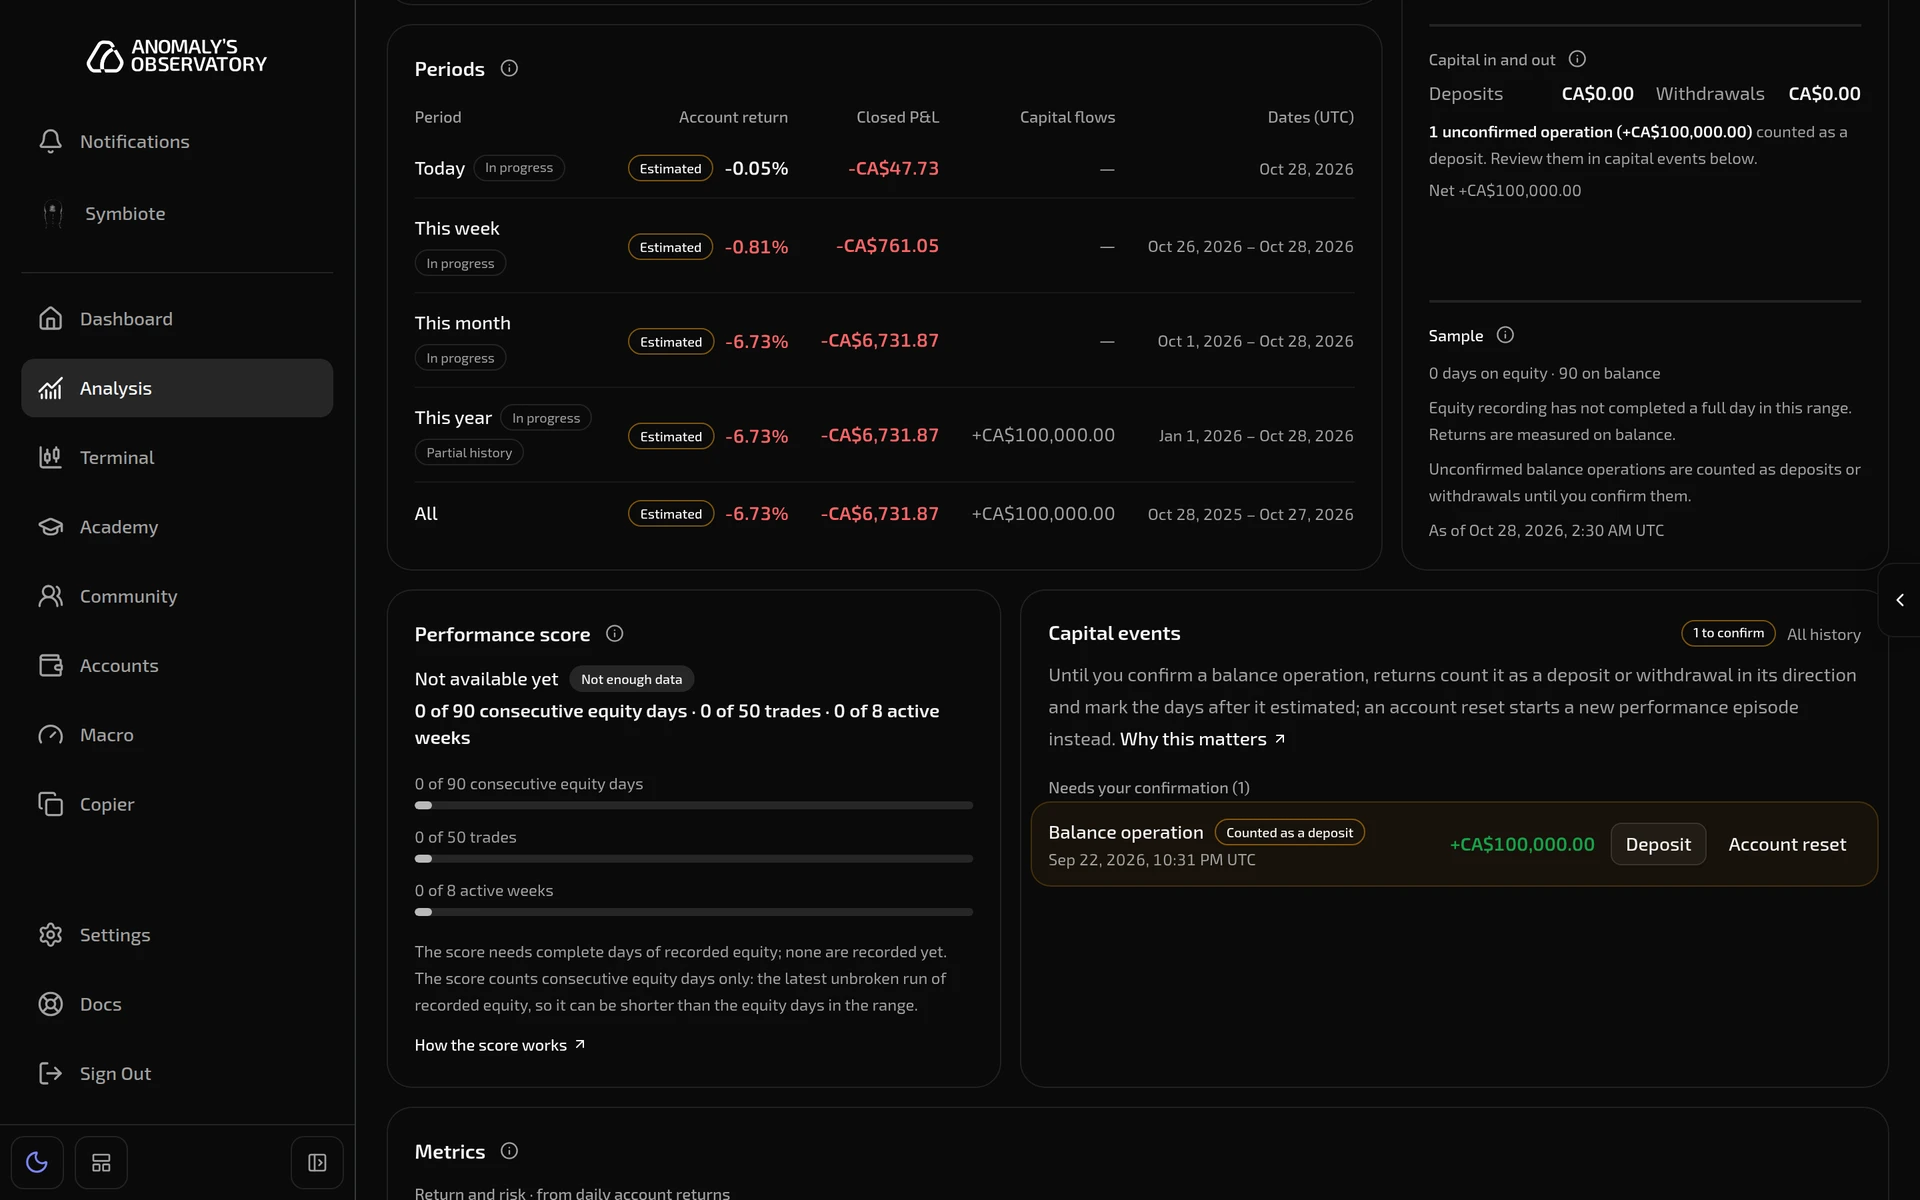
Periods lists Today, This week, This month, This year and All, each with its account return, closed P&L, capital flows and UTC dates. In progress marks a period that hasn’t ended, and Partial history marks one that starts before the account’s history does.
Performance score
The score rates the account out of 10 from five parts:
| Part | Weight | What it measures |
|---|---|---|
| Risk stability | 30% | How shallow the worst fall from a peak has been. A fall of 20% or more scores 0. |
| Risk/return | 30% | Return for the variation taken, against a Smart Sharpe target of 2. |
| Consistency | 20% | The share of complete active weeks that finished positive. |
| Recovery | 10% | How long the longest stretch below a peak lasted. 90 days or more scores 0. |
| Sample | 10% | The evidence behind the score: closed trades against 200 and days against 365, whichever is lower. |
It needs 90 consecutive days of recorded equity, 50 trades and 8 active weeks. Until then it says Not available yet and shows how far along each requirement is. How the score works opens the full method.
Confirm capital events
A balance operation from your broker can be a deposit, a withdrawal or an account reset, such as a prop firm resetting a challenge. Until you say which, V2 counts it as a deposit or a withdrawal in its direction and marks the days after it as estimated.
- Under Capital events, find the operation under Needs your confirmation.
- Choose Deposit (or Withdrawal for money out) to confirm what it was.
- Or choose Account reset, then Confirm reset. A reset starts a new performance episode from that date, so returns aren’t chained across it.
A confirmed operation says Confirmed by you. Click Change to answer differently. Operations your broker’s record already identifies say From the broker record. Some kinds of balance change can’t be confirmed here, and the returns around them stay estimated.
Metrics
Metrics has two groups:
- Return and risk, from daily account returns: Sharpe, Smart Sharpe, Sortino, Volatility, VaR 95%, cVaR 95%, Average drawdown, Average drawdown length, Calmar and Recovery factor.
- Trades, from your closed trades: Profit factor, Expectancy and Holding period.
Click the i beside a metric for its definition. A metric without enough data says Not enough data and what it needs. For example, VaR needs 100 complete days and Calmar needs 365.
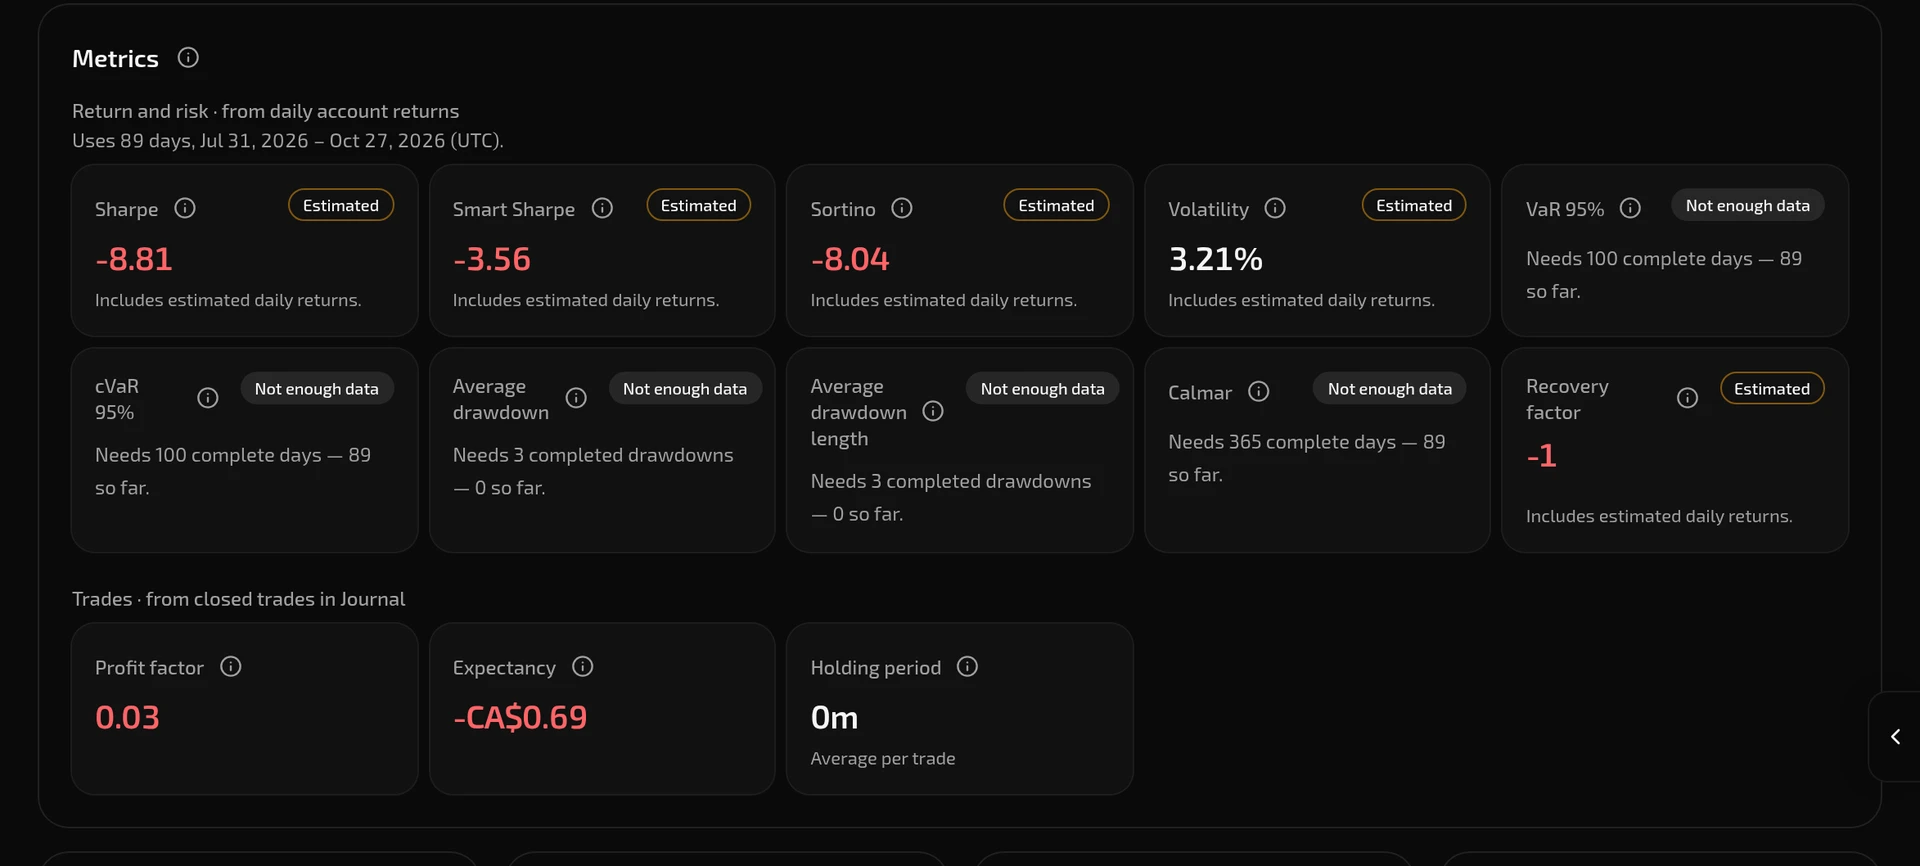
Below the metrics, the rest of Overview matches V1, with closed-trade charts named for what they show: Cumulative closed P&L, Closed P&L drawdown, Daily Performance and Monthly closed P&L. The calendar can switch between Closed P&L and Account return.
Return
V2 adds these to the Return tab:
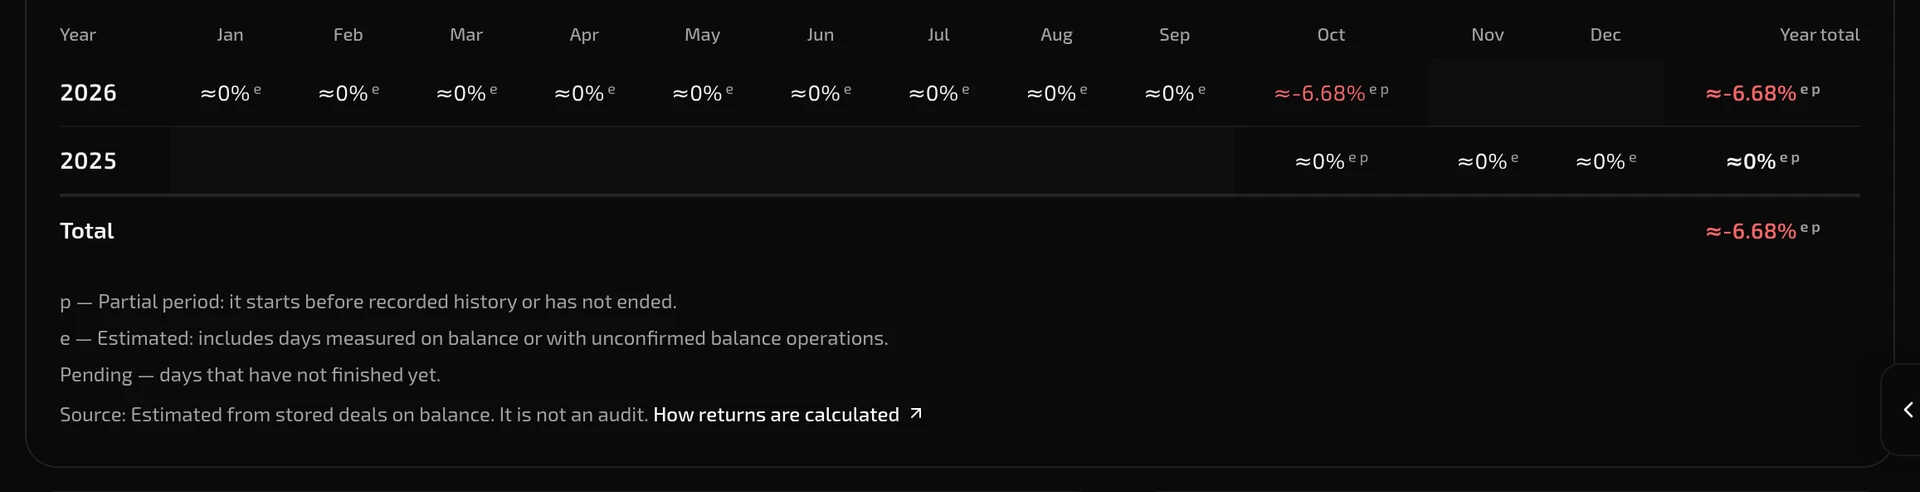
- Statement: the account’s net return for each UTC month, compounded for each year, with a total. ≈ and e mark estimated months, p marks a partial month (one that starts before the account’s history or hasn’t ended), and Pending marks days that haven’t finished. Download PDF saves the statement as a PDF.
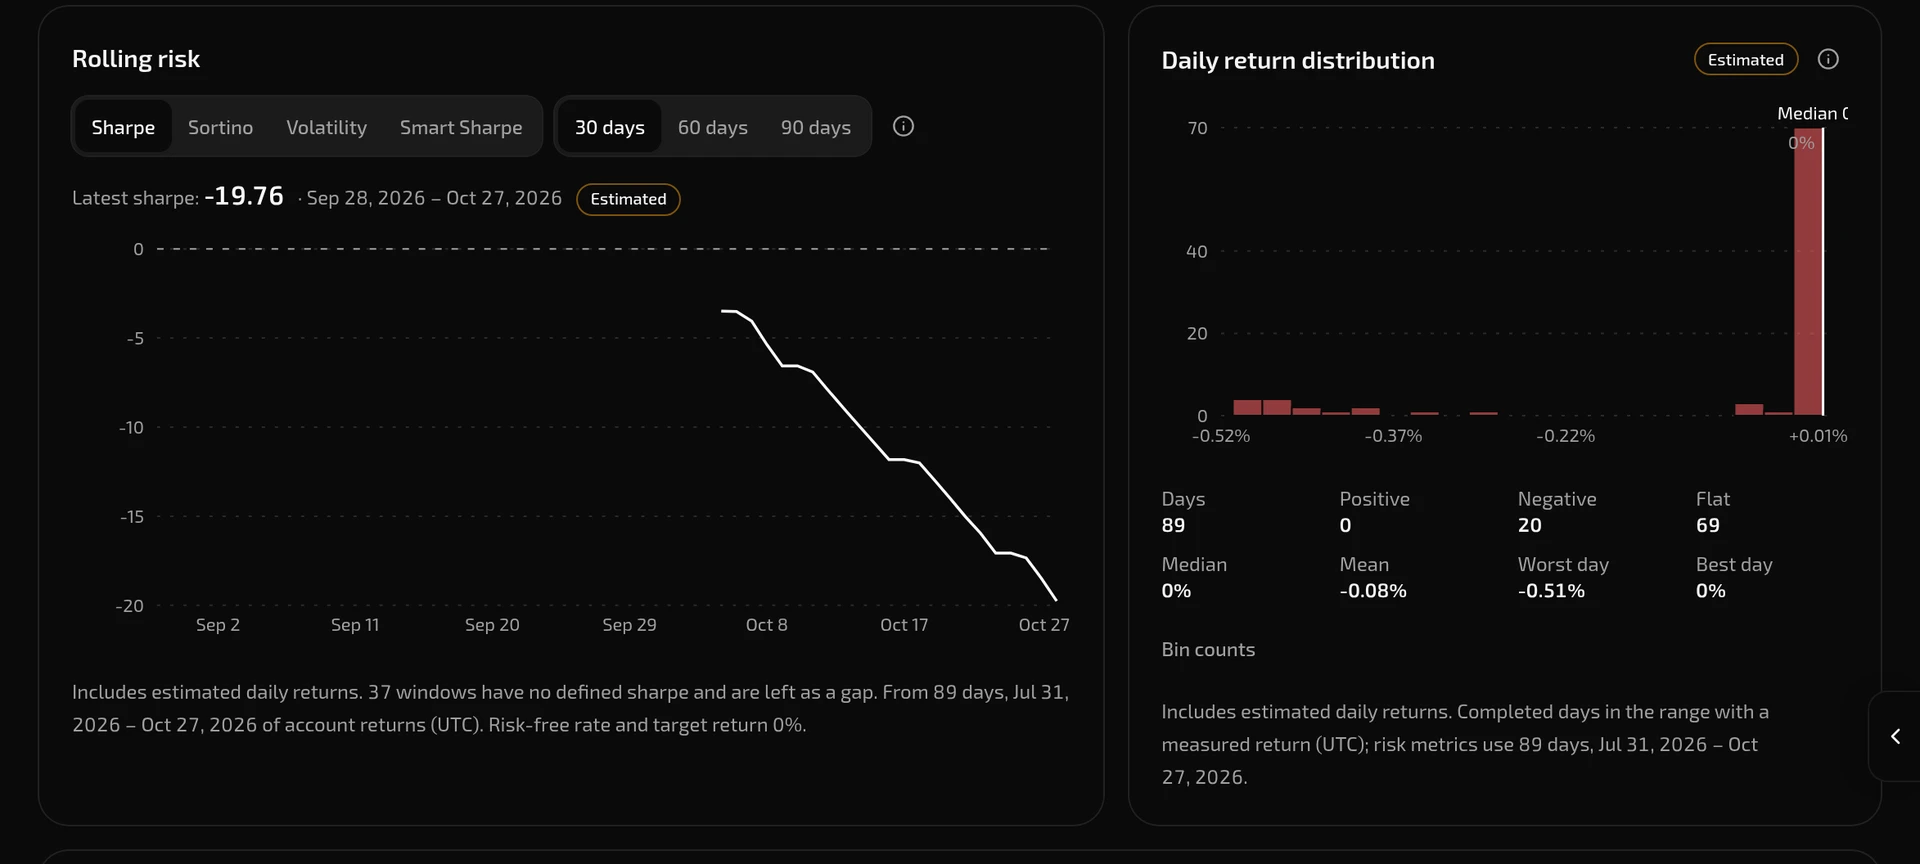
- Rolling risk: Sharpe, Sortino, volatility or Smart Sharpe over a rolling 30, 60 or 90 days.
- Daily return distribution: how the account’s daily returns spread, with the median, mean, worst day and best day.
- Closed-trade reports By session (Asia, London and New York, with their overlaps), By weekday, By hour of entry, and Long and short by symbol. These are built from the 500 most recent trades in the scope.
Risk
V2 adds these to the Risk tab:
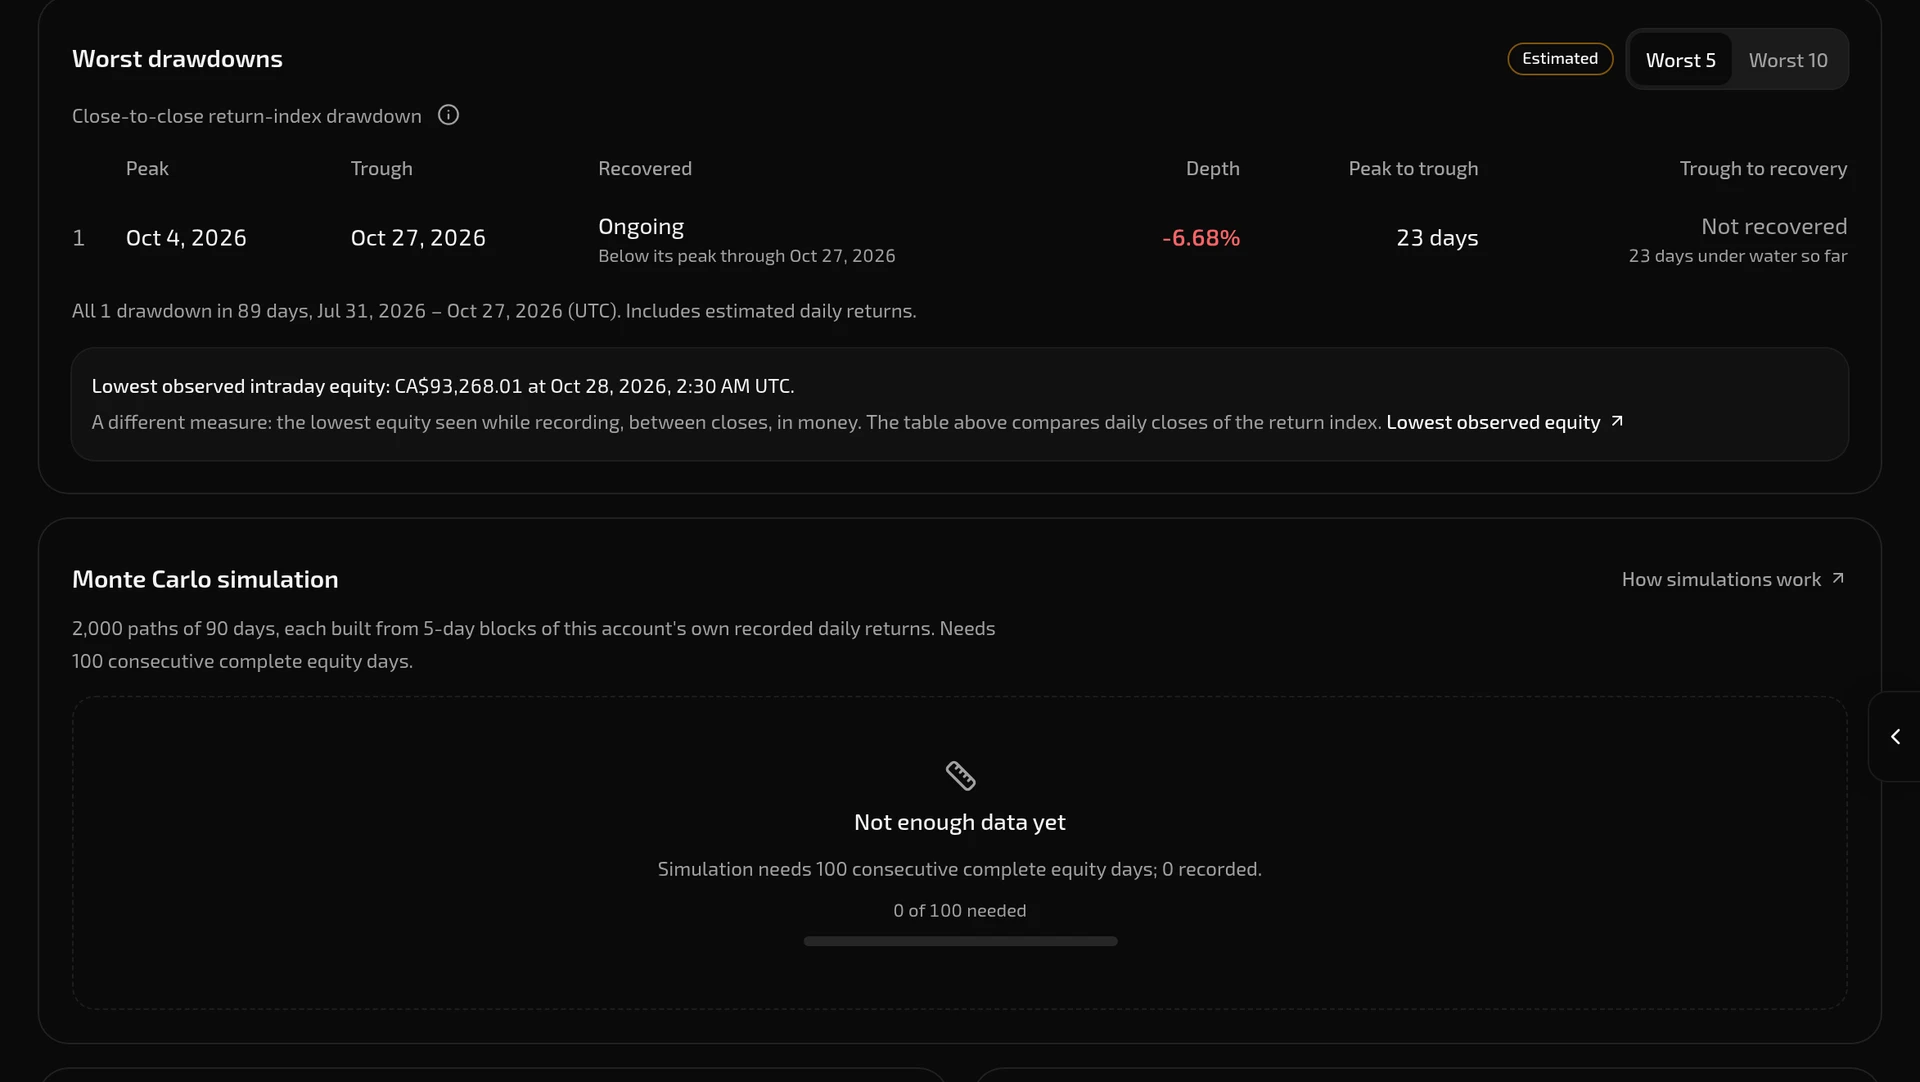
- Worst drawdowns: the deepest falls of the account’s return, measured from one daily close to another. Each shows its peak, trough and recovery dates, its depth, and how long it took to fall and to recover. Switch between Worst 5 and Worst 10.
- Monte Carlo simulation: 2,000 possible 90-day paths, each built from 5-day blocks of the account’s own daily returns. It needs 100 consecutive complete days of recorded equity, and shows how far along it is until then.
How we calculate
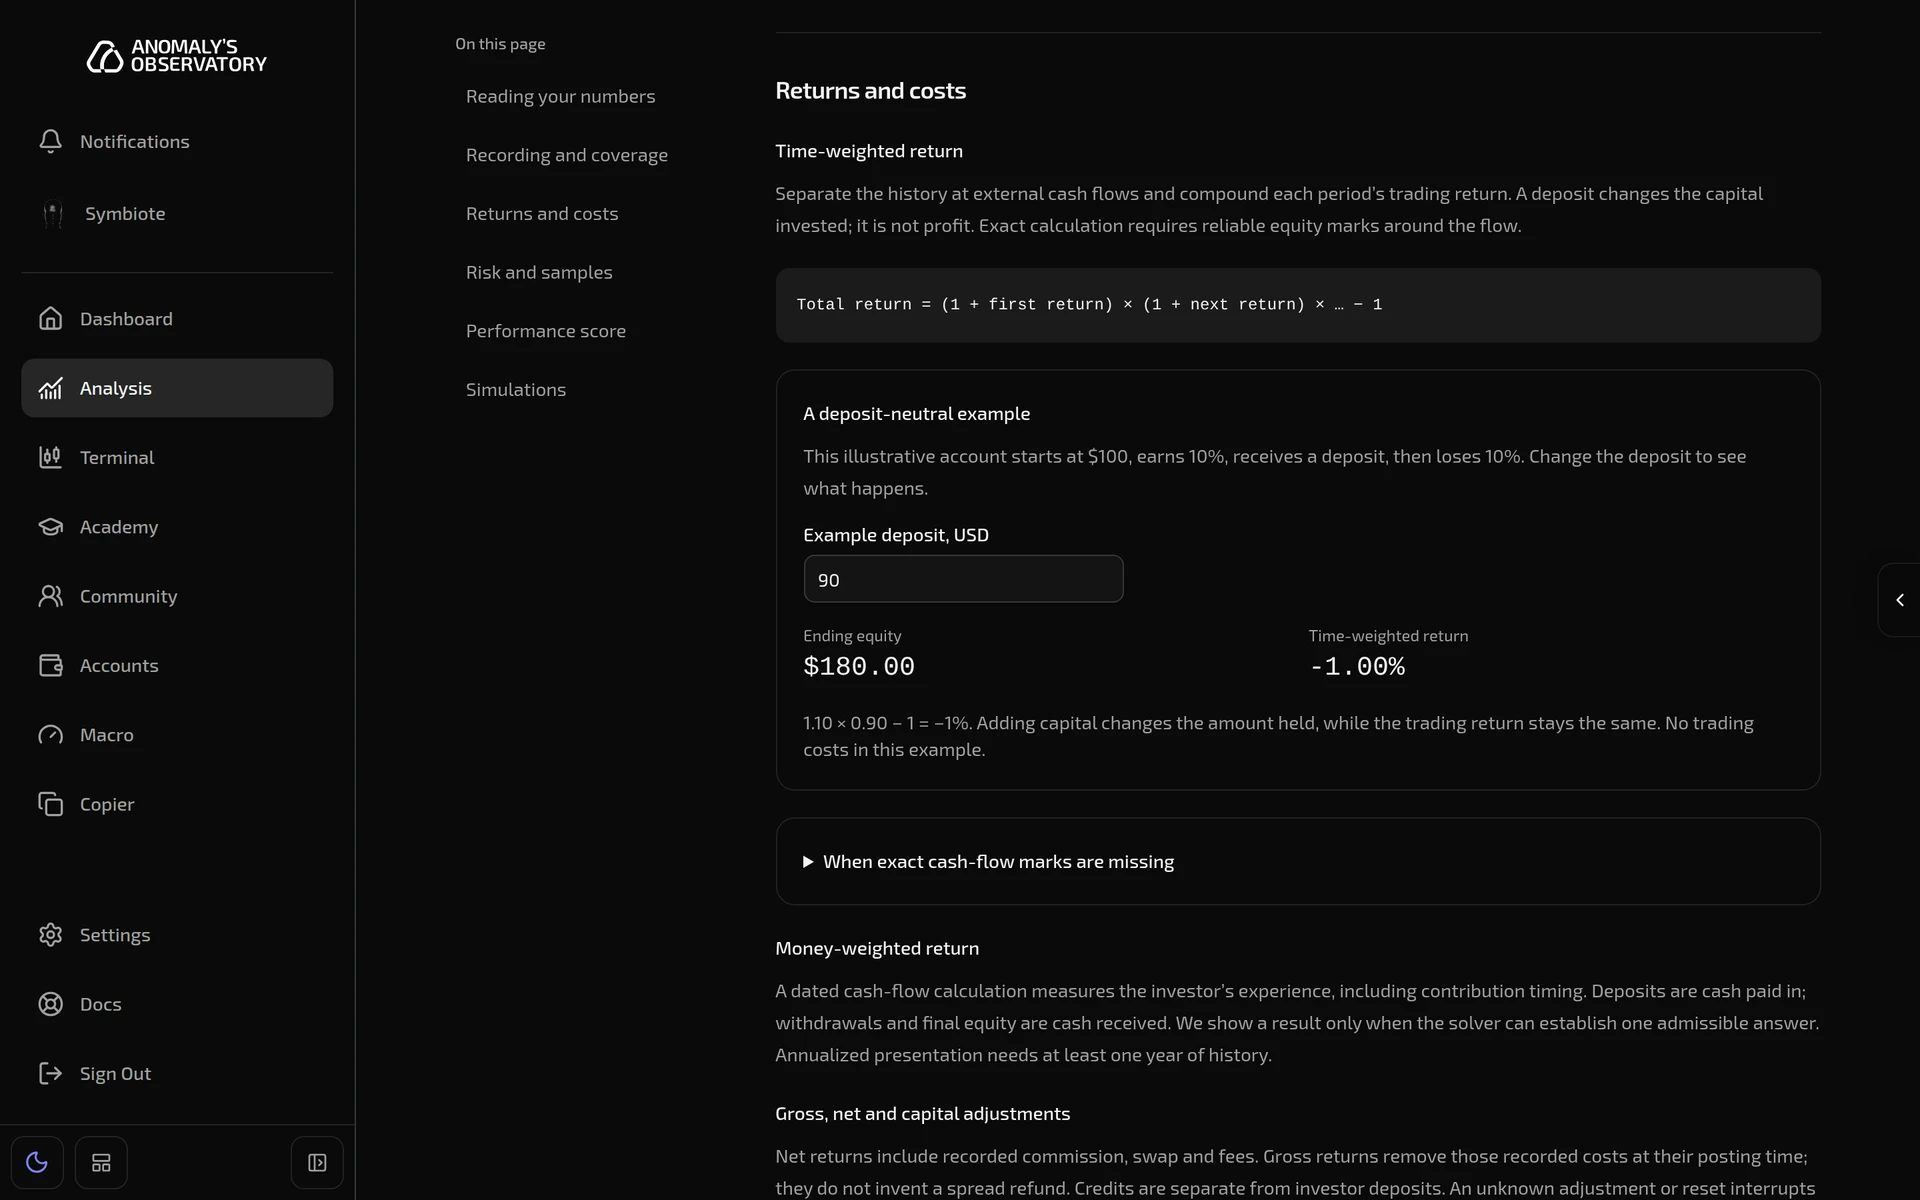
How we calculate explains every V2 figure: how days are measured, how returns stay neutral to deposits and withdrawals, how costs are counted, the sample each risk metric needs, and how the score and simulations work. Its A deposit-neutral example lets you change a deposit and watch the account’s return stay the same. Back to Analysis takes you back to the same account and range.
Good to know
- Days and periods follow UTC.
- Balances and returns in different currencies aren’t added together. If your accounts use more than one currency, pick one account to see its performance.
- V2’s figures describe what already happened in your account. They don’t predict results.